As Snr. Instrument and Control Engineer that supports the operation. In this case study, the writer supports the Corrosion and Inspection Team. On certain occasions, a study will be performed to support their objective. The case study is to provide cool fluid to the cooling probe in order to simulate the potential TLC in the subsea multiphase pipeline. This led to increasing the integrity of the subsea multiphase pipeline.
This is not a daily task for an instrumentation engineer. However, a variety of instrumentation devices or equipment includes electronic, pneumatic, and hydraulic therefore in certain cases the equipment is categorized as instrumentation. The writer provides options and schemes to solve their problem.
I. BACKGROUND
As part of the mitigation of ToLC in the pipeline, VCI (Volatile Corrosion Inhibitor) will be injected. To monitor the effectiveness of VCI injection, a cooling probe needs to be installed. The cooling probe will simulate the potential TLC in the subsea multiphase pipeline, which is achieved by cooling the probe which simulates the cooling effect of seawater. With this new method, can continuously monitor the ToLC rate and furthermore evaluate the chemical performance that has been applied.
II. Objective
Trial vortex tube performance to achieve cool down inside cooling probe with the temperature at 10-20 degC.
III. Methodology
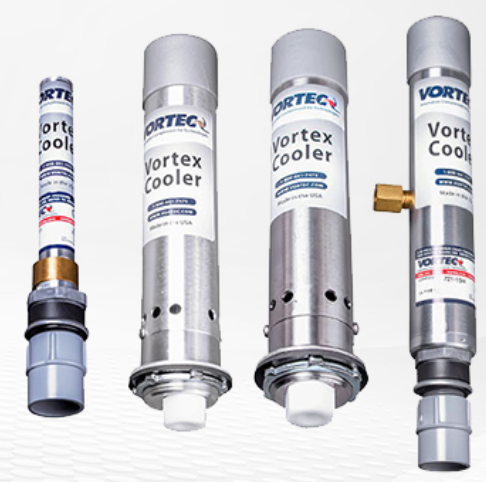
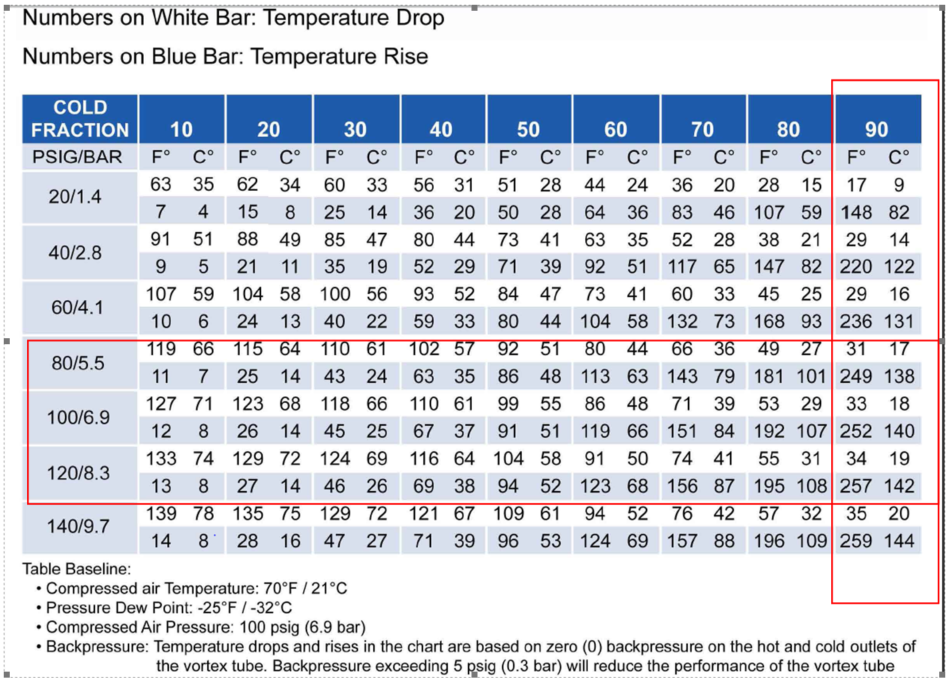
The methodology to cool down inside the cooling probe could be a number of possibilities to cool down the probe. The writer proposes using a vortex cooling product from Vortec (https://www.vortec.com/en-us/vortex-coolers). The selected model vortex tube requires a continuous gas supply 11 SCFM with pressure inlet available. The cold fraction is expected 90%.
This is sample measured on manufactured laboratories for 208-15-HSS tube at 100 psig:
Cold fraction (%)
Valve open
100
0°-full closed
90
90° counter clockwise
80
210° CCW
70
380° CCW (one full turn plus 20°)
60
570° CCW (one and a half full turns plus 30°)
50
750° CCW (two full turns plus 30°)
The cold fraction is to predict the temperature drops and rises in the vortex tubes for various inlet temperatures. The cold fraction will determine the opening valve at the hot end.
Backpressure exceeding 5 psig (0.3 barg) will reduce the performance of the vortex tube.
The cooling fluid is using nitrogen from a bottle of nitrogen. As consequence, the instrument air is not available on the platform. The drawback of using a rack of bottled nitrogen on an offshore platform is logistic issues. Since it is not intended for continuous operation but rather for evaluation in certain periods of time.
To control the desired cold temperature, cold airflow and temperature are easily controlled by adjusting the slotted valve in the hot air outlet. Opening the valve reduces the cold airflow and the cold air temperature. Closing the valve increases the cold airflow and the cold air temperature. Adjusting the valve will alter the cold fraction; the maximum cold fraction could be achieved at 90% cold fraction. To achieve 90% cold fraction valve is turned 90° counter clockwise.
Since the supply is using a rack of bottle nitrogen, inlet pressure to vortex tube is not constant and it will decrease continuously. Thus it will affect the outlet temperature in both the cold and hot ends as per table 1. The temperature range is represented in table 1. The table is derived from absolute ratio table 3.
Cold Fraction
90
PSIG/BAR
OC
1.4
Temperature Cold End
25.106
Temperature Hot End
121.133
2.8
Temperature Cold End
18.122
Temperature Hot End
163.036
4.1
Temperature Cold End
18.122
Temperature Hot End
172.347
5.5
Temperature Cold End
16.958
Temperature Hot End
179.913
6.9
Temperature Cold End
15.795
Temperature Hot End
181.659
8.3
Temperature Cold End
15.212
Temperature Hot End
184.569
9.7
Temperature Cold End
14.631
Temperature Hot End
185.733
Table 1
Pressure inlet is maintained by pressure regulator valve (set @6.9 barg). Outlet pressure regulators will fluctuate around 6.9 barg – 5.88 barg according to the flow rate curve. Hence outlet cold end will fluctuate at 14oC-18oC.
To protect vortex tube from excess pressure, Pressure Safety Valve (PSV) at the inlet line vortex tube is installed to avoid inlet pressure above 10.3 barg.
With selected vortex tube and cold fraction set 90% cooling capacity yield 640 BTU/Hr.
Inside the cooling probe, 2 heat transfer convection occur, namely natural convection and forced convection. However, in this cooling system, only force convection is considered. Natural convection is ignored since the focus is the cooling surface temperature of the element sensor.
Force convection at the surface cooling probe is calculated using assumption 80OC at surface temperature and flow cool air at 15OC which resulted in loss heat rate 77.876 BTU/Hr. Thus using a cooling capacity 640 BTU/Hr is adequate to maintain 15 – 20OC at the surface of the element sensor to create condensation
The performance of the vortex tube is depending on the stability of inlet pressure and flow rate. Replacement of bottle nitrogen is calculated based on the performance vortex tube. The performance of vortex tube is optimum when the flow rate is maintained at more or less 11 MMSCFD. To maintain the optimum flow rate range, bottle nitrogen should be replaced when pressure below 17 barg.
It is estimated that for 8 hours of sampling, it requires 6 bottles of nitrogen to supply the vortex tube at 11 SCFM.
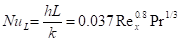
The convection heat transfer of the cooling probe is complicated since it involves fluid motion as well as heat conduction. The convective heat transfer coefficient “h” strongly depends on the fluid properties and roughness of the solid surface, and the type of fluid flow (laminar or turbulent).
The case of cooling probe heat transfer is similar to flow over a flat plate. This analogy is adopted since heat transfer is focused on the bottom of the sensor surface.
It is found that the Nusselt number can be expressed as:
where L=D=Diameter
For isothermal surface plates, the local Nusselt number for turbulent is:
Assumptions:
It is assumed that the velocity of the fluid is zero at the surface; this assumption is called no-slip condition. As a result, the heat transfers from the solid surface to the fluid layer adjacent to the surface by pure conduction, since the fluid is motionless.
Which is valid for 5 x 10⁵ < Re < 107 and 0.6 < Pr < 60. The fluid properties are evaluated at the free-steam temperature T∞, except for µs which is evaluated at surface temperature.
Heat Loss required (Please refer to Calculation Note – Attachment 1)
This is one of my case studies to calculate the volume vessel of a Diesel Tank.
The purpose of the scope of work was to improve diesel fuel management as part of a fuel management improvement campaign.
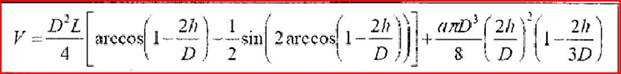
The objective is to convert measurement height liquid in Diesel Tank to volume basis (in liter). The level transmitter type was DP(Differential Pressure) transmitter using hydrostatic pressure to measure the level.
According to process calculation of vessel diesel tank.
(Partial liquid volume of the tank with ellipsoidal head).
where
It was Putting this equation direct to DCS (TDC3000) one function of arccos was not available
Option I :
Using the trigonometry function found on the list of Built-in Arithmetic
This approach is manipulating the original equation using the available function on the controller PCS, unfortunately, it becomes more complicated, but the advantage it has no error
Option II:
Using the Regression Linear approach.
Option III: Totalizer
Totalizer is one feature that is available in flow computers. This totalizer has a function to accumulate the volume.
Error in option I and option II originated from % error measurement and % error calculation due to error measurement. That is the reason why it doesn’t match the sounding table
On the other hand, totalizers don’t respect the shape of the vessel. Therefore it could minimize the error resulting from measurement, However, the outlet of the vessel should be equipped with a totalizer the outlet
Thus the remaining volume vessel is Qremain=Qin-Qout.
This should be written in the PLC to retrieve the value in the control room along with the push button start and stop.
The objective of this article is to correlate control systems in theory and real practice through calculation by using available data from engineering documents.
II. Background
Throwback, it was the writer’s responsibility to design, and programmed, both HMI and PLC. The objective was to control fuel gas as a supply to the generator power plants.
In the initial condition, the pressure is controlled using a pneumatic controller. The electronic controller was introduced as backup and improved pressure control.
The control valve regulates fuel gas is to maintain the minimum pressure and flow rate requirement of the power generator. The objective to control pressure downstream is to meet the requirement of power generation. If the pressure is not controlled and tends to be high it will not meet the requirement.
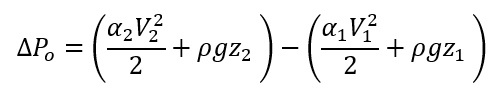
The control valve functions as regulator pressure (reducing pressure) while limiting the maximum flow rate. The basic controller is PID. The selector of two controllers is based on the maximum setpoint either flowrate or pressure operates as a high selector. Therefore one control valve will have 2 controllers i.e., pressure control loop (PIC) and flow control loop(FIC). The input was pressure. It is to control downstream pressure. The control valve act as pressure reducing. It is placed after the control valve between 3D-5D. The pressure loop for gas pressure can be characterized as fast and noise-free. While, the flow loop can be characterized as relatively fast, nonlinear, and often noisy.
The usual application for this type of situation is that one process variable controlling variable during normal operation. In the event of abnormal operation, however, some other process variables should be limited. The limiting controller is said to “override” the normal process controller, hence, this technique is often termed “override control”.
Control method for high selector using electric controller could be implemented directly using the program. Another scenario to limit flow rate is using a mechanical stopper. It is often used for pneumatic controllers but still applicable for an electronic controllers. However, the mechanical stopper is more feasible if it is already purchased initially. Installation mechanical stopper in the middle cycle of the valve will have to consider many things and consult with the control valve manufacturer.
The setpoint between FIC and PIC should be bumpless transfer. Bumpless transfer means that transition is based on the latest position of output.
II. BLOCK DIAGRAM
As in general PID block diagram. As seen below. It uses feedback control. to control the fluid parameter.
Since the pressure and flowrate controller doesn’t interact with each other. It could be considered as a separate controller. Therefore we could evaluate each loop with a different setting value.
The writer’s objective is to implement value from theory to actual. To create a seamless integration between theory and actual in order for control theory to work on the plant. Let us walk through all blocks.
III. PROCESS
III.1 Process Dynamic Model
III.1.2. Degrees of Freedom
The number of degrees of freedom for a system is defined as
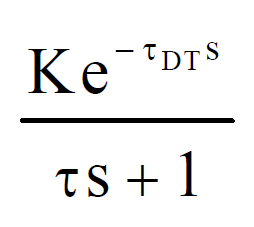
The first step is to identify the system. All models will be approached using mathematical models to predict a system’s behavior. Many process models are based on the ideal first-order plus dead-time(FOPDT). The FOPDT is commonly used for single-input, single-output (SISO) loops.
DOF = NV- NE,
with DOF equal to the number of freedom, NV equal to the number of dependent variables, and NE equal to the number of independent equations.
NV, equal to the number of dependent variables, and NE is equal to the number of independent equations.
III.1.2.a Pressure Control
Manipulated Variables
Description
Pressure =100 – 150
Pressure (psig)
Independent Variables
rho = 1000 (independent)
Density of water (kg/m3)
gravity = 9.8 (independent)
Gravity (m/s2)
Differential States
Pset
145 psig
III.1.2. b. Flow Control
Manipulated Variables
Description
flowrate (Q) =38.3
Volumetric Flowrate (MMSCFD)
Independent Variables
rho = 1000
Density of water (kg/m3)
gravity = 9.8
Gravity (m/s2)
Differential States
Qset
36 MMSCFD
III.1.3 Balance Equations
Overall Material Balance
In ideal state Qin = Q out, however since we will consider loss flowrate due to friction and control valve pressure drop.
{mass out} – {mass in}+Accumulation of mass=generation
ρ is the amount of the quantity q per unit volume,
j is the flux of q,
t is time,
σ is the generation of q per unit volume per unit time. Terms that generate q (i.e., σ > 0) or remove q (i.e., σ < 0) are referred to as a “sources” and “sinks” respectively.
Pressure drop in the piping system in this system consider:
1. Loss due to friction
2. Loss pressure in control valve
Using Bernoulli’s principle and Darcy-Weinbach as pressure drop along the pipe.
For pipe illustration as follows:
Based on the Bernoulli’s principle.
No change elevation and fully developed flow through a constant area pipe. Hence the equation will be in the form
III.1.4 Loss due to friction
Resistance coefficient, abbreviated as K, a dimensionless number, is how much resistance to the flow an obstacle has. This is the opposite of the flow coefficient which is how much flow capacity an obstacle allows.
frictional pressure drop across the line, fittings, equipment, etc. in series
The constant friction coefficient for the line, fittings, equipment, etc., psi/(gpm)2
The specific gravity of the liquid
flow through the valve and line, gpm
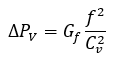
Loss pressure drop across the valve:
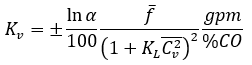
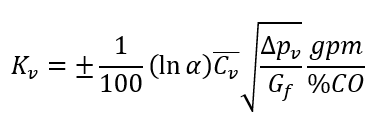
a1,a2, Gf, kL, and Cv ar independent variables (NE)
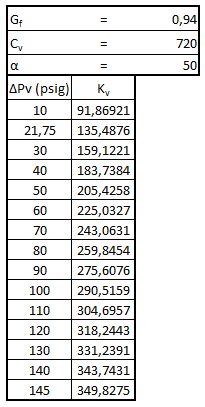
The valve is 4 in valve with Cvmax = 720 is selected and the pressure around the valve is independent of flow. Consider both a valve with linear characteristics and an equal percentage valve with a rangeability parameter of 50.
In general, the resistance of the liquid level system is expressed as:
The process model for a single loop is often First Order Plus Dead Time (FOPDT). First-order could be solved in the time domain or in frequency response.
There are 3 unknown parameter
III.2 Gain (K)
The gain of any signal-processing device (think of an electronic amplifier) is the ratio of output to input or the ratio of the change of output to the change of input. Since the signal to the valve is the process input the measurement is the process output, then Gain could be contributed from 3 different areas.
There are several models that could be approached using the First Order model such as
Filling a Tank
A disk flywheel
Resistor and Capacitor Schematic
Gain(Kp)
Time Constant
Apparent Dead Time
The characteristic form of the transfer function of a first-order plant is
Where K is gain, tau is time constant
III.2.1 Process Gain
Process gain is the change in the output y induced by a unit change in the input x.
In simplification, the gain for pressure and flow control :
Pressure Transmitter range: 0-15 barg with setpoint 9.9 barg
Gain, Output = Flow, Input : Controller output signal
Gain Process (PIC) = 100 – 0/ 15-0 = 9.5
Gain Process (FIC) = 100 – 0/50 -0=2
However, I will try to approach the piping system (pressure loss and valve) with the control valve in the first-order model plant.
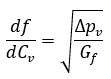
Chain rule of differentiation
Equal percentage characteristic
Therefore the gain valve for pressure drop 21.75 psig and Cv=720 is 135,478. During the regulating valve will travel between 30-70 %. We will take at opening
III.2.2 Time Constant
The time constant, usually denoted by the Greek letter τ (tau), is the parameter characterizing the response to a step input of a first-order, Linear Time-Invariant (LTI) system. The time constant is the main characteristic unit of a first-order LTI system. Therefore, the process time constant is the amount of time needed for the output to reach 63.2% of the way to steady-state conditions. The process time constant affects the speed response.
If the initial condition y(0)=0 and at t = time constant, the solution is simplified to the following 0.632Kp x input
III.2.2.a Determining time constant
Determining time constant is using
HMI and graphic chart
Calculation
III.4 Time delay
III.4.1 Determining Delay Time
The time delay is expressed as a time shift in the input variable. The time delay from a single control loop is contributed from
a). Transducer
b).Controller
The filter could cause an additional time delay. The filter is used to eliminate unwanted noise and background.
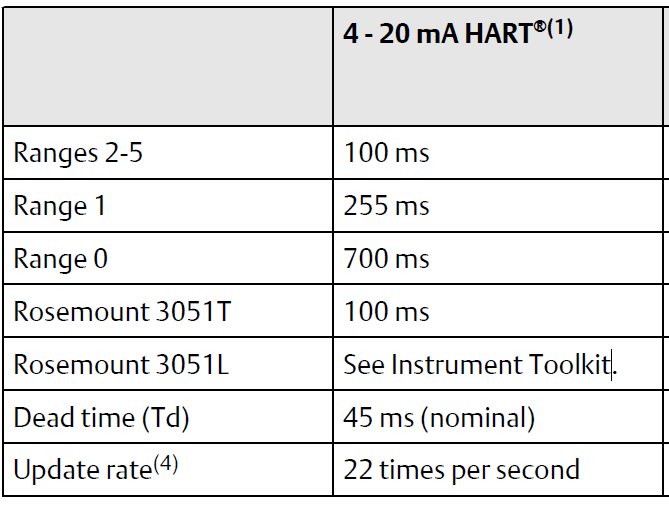
a).Transducer
The sensor is pressure transmitter Rosemount 30151. In gage applications, it is important to minimize pressure fluctuations to the low side isolator. Reducing process noise. Rosemount 3051CD draft transmitters are sensitive to small pressure changes. Increasing the damping will decrease output noise, but it will further reduce response time.
Damping. The damping command changes the response time of the transmitter, higher values can smooth variations in output readings caused by rapid input changes. Determine the appropriate damping setting based on the necessary response time, signal stability, and other requirements of the loop dynamics with your system. The damping command uses floating-point configuration, allowing you to input any damping value within 0-60 seconds.
The pressure transmitter contributes a dead time of 45 ms. The dead-time function is also called the time-delay, transport-lag, translated, or time-shift function (Fig 2.3). It is defined such that an original function f(t) is “shifted” in time. One method of reducing fluctuations in atmospheric pressure is to attach the length of tubing to the reference side of the transmitter to act as a pressure buffer.
Output damping. At the factory, Emerson sets the output damping for the Rosemount 3051CD to .32. If the transmitter output is still noisy, increase the damping time. If you need a faster response, decrease the damping time.
b).Controller / PLC
The controller will add a two-component delay time
Input filter on channel analogue input
Scan time
Therefore the total delay time = Dead Time (Transmitter) + Input Filter (AI) + Scan Time (PLC) = 45 ms + 1s + 250 ms
Filter(AI) + Scan Time (PLC) = 1295 ms
The total loop dead time is seen as the time it takes for the process variable to start to respond in the correct direction for a change in a controller’s setpoint or manual output.
IV. SIMULATING
Data from process input and output could be plotted using python (via jupyter notebook) for this simulation. I will try to compare the model for first-order and model approach using data as calculated. The input is using step function which
Model-based on FPDOT
Model-based on Process data
Kp=135 time constant = 5.0
Kp=135 time constant=5 delay time= 1.295 s
V. IMPLEMENTING CONTROL STRUCTURE
The controller could be electrical, pneumatic, or hydraulic. The electrical controller is usually represented as PLC or PID modular form.
The controller could be implemented as a pneumatic controller and electronic controller. Both have advantages and disadvantages. This variety of products depends on the availability of electrical sources.
If the process is in live condition. The control valve could start in manual mode. As informed in the previous section, the PID form is using PLC SoMachine Basic. PID Controller to implement a mixed (serial-parallel) PID correction. The integral and derivative actions are both independent and in parallel. The proportional action acts on the combined output of the integral and derivatives actions
The component PID controllers is
Proportional, The proportional controller directly affects the gain.
Integral, eliminate transient error
Differential, reduce error rate.
PID control form consists of
Parallel
Ideal
Classic systems identification methods to obtain the first-order model of the system as:
Ziegler-Nichols method;
Smith’s method;
Sundaresan’s method
Nishikawa’s method
However, often this method is not directly applied during the commissioning of the control valve and PLC. Most of the time it is tuned by trial.
All of the methods, in a simple way, it could measure and gather to obtain the trending on HMI and PLC database in time series.
Field sensors/Instrumentation Gain
Process Gain,One term that will be used frequently is process gain, designated Kp.
Final Element/Valve Gain
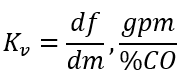
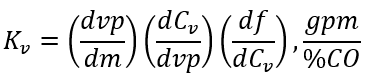
Valve gain (Kv) is the slope of the valve characteristic curve. The slope is the ratio of the change in flow to the change in travel. Thus, Kv=dQ / dY.
There are four factors that influence gain: valve characteristic, flow, valve size, and pressure drop.
In live process, changing the input process is difficult.
The other way more feasible is using simulation in PLC or current injection while the process is shut down. However the downside is it could not represent the real reaction of the system.
Both PLC and HMI is using the same brand manufacturer i.e. Schneider
The PLC is using PLC Schneider M221. The Analog input is 16 bit (maximum raw data is 65536) but it is limited to 16221 discretization level. The analog output is 12 bits. The maximum raw data is 4096. The disadvantage different bit Analogue Input, and Analogue Output.
The consequence is when processing the PID. There are 2 flow conversion data.
Any analog filtering that may be required (to reduce the problem of aliasing)
Interactive or Non-Interactive Controller?
It could be different between the PLC. SoMachine PID consists of AutoTuning, PID, and PWM functions.
V.1 Computational Algorithms
Two different computational algorithms are used depending on the value of the integral time constant (Ti)
if Ti=0, an incremental algorithm is used
If Ti=0, a positional algorithm is used, along with +5000 offset that is applied to the PID Output
IV.2 Pneumatic Valve Controller
The proportional band adjustment knob positions the nozzle on the flapper. Increasing (widening) the proportional band moved the nozzle to a position where less input and more feedback motion occurs, which decreases the gain of the controller.
The fuel valve is designed as a fail-to-close type, then both controllers will be set for reverse action.
The reverse action means increasing process variable (pressure or flowrate) will decrease percentage output.
A direct-acting controller is one whose output tends to increase as the measurement signal increases.
A reverse-acting controller is one whose output tends to decrease as the measurement signal increases.
However in case, the fuels valve is designed as a fail-to-open type, then both controllers will be set for direct action.
Don’t forget that the reverse or direct action in consequence both Positioner and Controller action should be same
Proportional-Only Controllers
Proportional-Plus-Reset
Proportional Plus Reset Plus Rate Controllers
Proportional Band: 5 yo 500% of process scale span
Reset: Adjustable from 0.01 to more than 75 minutes per repeat (from 100 to less than 0.0135 repeats per minute)
Rate: Adjustable from 0 to 20 minutes
Typical Frequency Response: 1.5 hertz and 90-degree phase shift with 3.05 m (10feet) of 6.4mm (1/4 inch) tubing and 1639 cm3 (100 cubic inches) volume
The application is for reducing pressure so if the upstream increase the valve will reduce the opening. In reverse when the upstream pressure is reduced the valve will increase the opening to the setpoint.
So with this condition, it could apply direct control
4mA represent valve close
20mA represent valve open
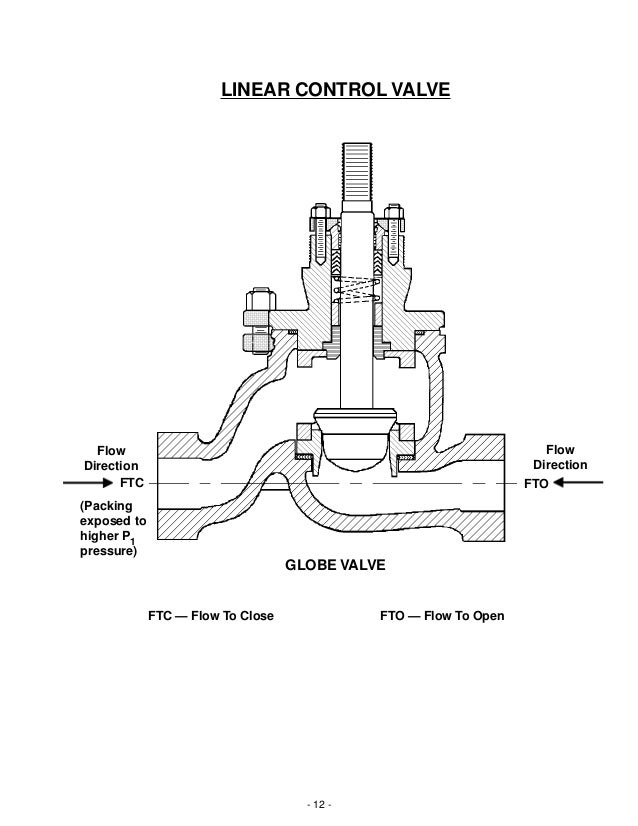
Now, we decide the direction flow to open or flow to close. It depends on the valve alignment. If you stated flow to open then the valve will be marked the direction from left to right meaning the left side will be upstream. If you stated flow to close then in the valve will be marked flow direction from right to left meaning the right-side will be upstream.
The controller function represents by PLC or pneumatic controller.
For Proportional-Only Controllers: Full output pressure change adjustable from 2% to 100% of the sensing element range for 0.2 to 1.0 bar (3 to 15 psig) or 4% to 100% of the sensing element range for 0.4 to 2.0 bar (6 to 30 psig)
For Proportional-Plus-Reset Controllers: Full output pressure change adjustable from 3% to 100% of the sensing element range for 0.2 to 1.0 bar (3 to 15 psig), or 6% to 100% of the sensing element range for 0.4 to 2.0 bar (6 to 30 psig)
Reset Adjustment For Proportional-Plus-Reset Controllers: Adjustable from 0.01 to 74 minutes per repeat (100 to 0.01 repeats per minute)
VI. Actuator and Valve
The actuator and valve is the final element to manipulate the variable process. Understanding the objective process is essential before determining the next requirement
Based on the actuator it determined fail close or fail open. This selection is coordinated with the process team during HAZOP to define the safety state position or which is more safety inherent. An additional feature could be added if the position of the control valve is the last position.
Fail open means if the pneumatic/electric to drive actuator is loss, the actuator’s spring will work to open
Failure close means if the pneumatic/electric to drive actuator is loss, the actuator’s spring will work to close.
Normally, the actuator acting mode is direct acting for fail-open valves and reverse-acting for fail closed valves. When ‘Fail-Lock’ position is selected, the control valve action in case of lock-up device failure shall be specified as well.
The type of actuator diaphragm or piston depends on the design differential pressure during the shutoff valve.
The most common use of a control valve is a globe valve. The relation between Globe valve consists of 3 different characters
Gain
Quick Open
Gain increases as the valve open
Linear Valve
Constant gain
Equal Percentage Valve
Gain decreases as the valve opens
Differential pressure across
Linear Valve
dP does NOT vary with flow
Equal Percentage Valve
dP varies with flow & processes with decreases in gains
V. CONCERN
Using I (Integral) to eliminate error could lead to a windup mechanism. Output saturation limits and built-in anti-windup mechanism
Selector pressure control and flow control should use signal tracking for bumpless control transfer and multiloop controls
Supply
Pressure reducing when it does not sense pressure it will fully open
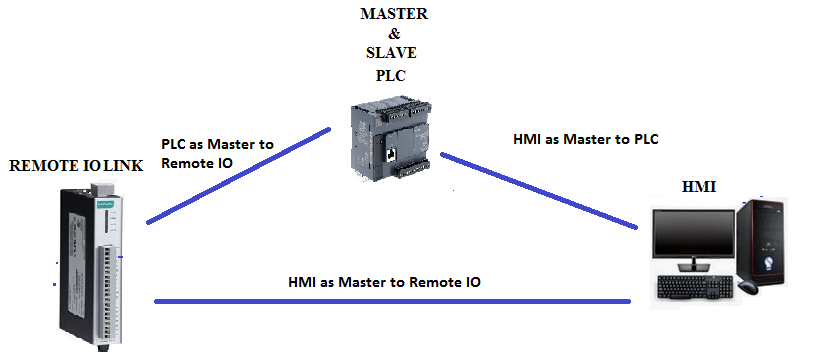
It was my first project as Control System Engineer at a System Integrator Company. System Integrator is responsible for integration between vendors. Furthermore, as a control system engineer, one doesn’t have to bind or represent the manufacturer or vendor.
The fruitage of working in a system integrator company is the ability to program both PLC and HMI for various brands.
Working to revamp obsolete PLC to the latest and different products of PLC includes converting the PLC program from the ladder to a function block diagram. The PLC is located remotely offshore at gathering/ manifold platforms with a swamp vicinity. It monitors surface facilities and is able to generate production shutdown. PLC uses the Modicon quantum 651 series.
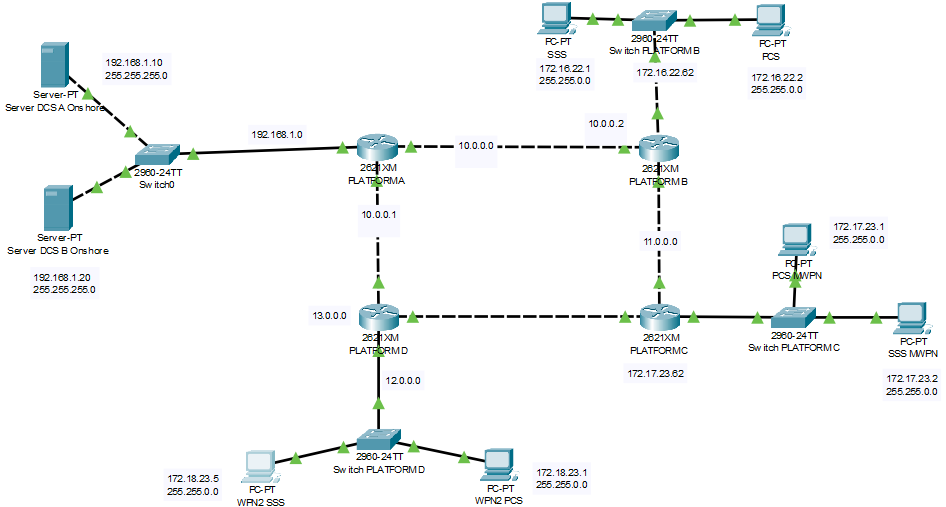
All data will be sent to the control room (onshore) via a telemetry system. DCS system deploys 2 systems i.e., TDC3000 and Experion PKS Honeywell. The obsolete PLC was connected to TDC3000. Although PLC has been replaced with the latest product the connection to TDC3000 is still maintained except for 1 RTU to be reassigned to Experion PKS based. Hereafter this specific RTU is called RTU No. 1 . For reference below is the simplified architecture (Schematic 1)
DCS reassignments for RTU No.1 are due to existing LAN interconnection being available near the manifold platforms.
RTU No.1 will be connected to another existing RTU via an ethernet switch. The existing RTU is using controller C200 Honeywell and is connected to DCS Experion PKS via radio TDMA.
We didn’t find major issues during this RTU revamping. The only thing is to ensure the Modbus address arrangement is the same as the existing one.
Additional work occurs for RTU no.1 to create a display since the relocation of DCS assignments
In order to maintain the project pace, it was decided to copy it from a similar display, existing RTU, on Experion PKS.
After changing the entire tag name and comparing the Modbus address on the PLC. The next step was generating runtime on the Experion. I discovered many message errors during the runtime. In the beginning, I was confused either the client.
After looking at all the message errors, I realize the source problem was caused by incompatibility between HMI web display scripting and the function block diagram on Modicon Quantum PLC. The existing display is designed by a control builder integrated into Experion PKS engineering tools.
So it required modifying all HMI Web Display scripts related to animation, such as faceplate, all dynamic shapes, etc, in order to be compatible with the functionality of function block diagram Modicon Quantum PLC. Although this was not easy, at the end it was finished without the attendance Honeywell vendor.
Due to this problem, I understand between the difference
between PLC+HMI and DCS.
Besides the term system architecture refers to DCS where more than one PLC is connected to the control station. DCS could also refer to software capability. DCS provides integrated software PLC+HMI up to SCADA.
Example of software with these types is Experion PKS, Delta V, and Centum VP.
The advantages of DCS software are as follows:
Reduced the effort required to design and
implement HMI.
It eliminates the complexity configuration between PLC and HMI.
However, it consumes more memory and processor capacity.
DCS is suitable for applications with much-advanced control, high diagnostics, etc. Therefore it is suited for complex and fixed process plants such as refineries, petrochemical, and power plant.
However, based on my experiences I found that DCS is not suited well for continuous expansion facilities such as offshore platforms.
An offshore platform continues to explore new wells which continues to add I/O and display.
I have experience with DCS with saturated memory and capacity processors on offshore platforms, although it is far from the maximum capacity of I/O or remote I/O.
Unless it is a separate system between fixed surface facilities and a group of continue facilities such as flow lines and wellhead platforms.
For example, DeltaV/Experion as the DCS while continuing expansion surface facilities use PLC.
The more you have experience the more you could decide when to use an application based on DCS or PLC + HMI.
Offshore platforms especially wellhead platforms have test facilities and xoffloading facilities. These facilities to obtain composition and performance of well. This data will forecast the lifecycle stages of well. According to ISO 16530 delineates the stages of the lifecycle into six lifecycle phases, Basis of design, design, construction, operational, intervention, and abandonment.
The average life span of an oil or natural gas well is up to 20 or 30 years. However, new technologies are being developed to find new ways to extend the life span. The life span of a well is based on the active years the well is in production. ‘Active’ is one of the six main life cycle classifications of a well.
Offloading and test separator has several typical designs. One of the different designs of test separators is using MPFM. If the wellhead platform The offloading activities involve KO drum to collect the liquid during offloading process.
This article will try to estimate the liquid of estimated tubing volume well by using available instrument measurement on the KO Drum Vessel. This article will be focused on KO drum as offloading vessel. This article will limit only 2 phase vessels.
II. OFFLOADING
Offloading a Well is a technique in which borehole pressure is reduced from a borehole in order to cause the suction of hydrocarbon fluids into the wellbore from perforations made in the casing. This is made possible by the creation of a partial vacuum by the removal of air so as to force the hydrocarbons into the vacant space, thereby initiating a flow of liquids from a well.
Offloading could be perform via Test Separator Vessel or Knock Out (KO) Drum.
Individual performance of well reservoir in wellhead platform is tested either using Multiphase Flow Meter (MPFM) or Test Separator. Therefore, test separator is part of offloading process besides as well individual test.
The test system on the platform will consist of a test manifold and an MPFM/Test Separator. Flow from each well can be diverted from the production manifold to the test manifold by changing the position of the On-Off valves located upstream of the production and test manifolds.
Incase MPFM is utilize to simultaneously measure the flow rate of each phase of fluid coming from a well., KO drum is used as part of Offloading process where it capture liquid if the wellhead platform utilize MPFM.
The test manifold will be utilized during both test and offloading; during test, the fluid will be sent to the MPFM and then to the Export Trunkline, while during offloading the fluid will be sent to the Vent/Flare.
III. VOLUME VESSEL BASIC THEORY
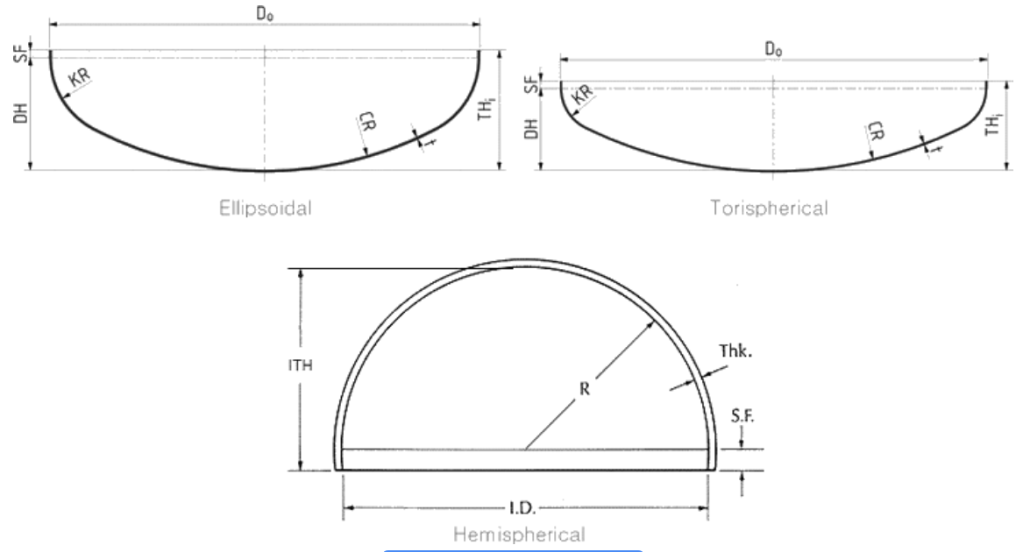
III.1. ELLIPSOIDAL HEAD For pressure over 10bar, ellipsoidal heads are often used. This is also called a 2:1 elliptical head. The shape of this head is more economical because the height of the head is just a quarter of the diameter. Its radius varies between the major and minor axis.
III.2. HEMISPHERICAL HEAD A hemispherical head is the strongest shape; capable of resisting about twice the pressure of a tori spherical head of the same thickness. A sphere is an ideal shape for a head, because the pressure in the vessel is divided equally across the surface of the head. The radius (R) of the head equals the radius of the cylindrical part of the vessel.
III.3 TORISPHERICAL HEAD A tori spherical shape, which is extensively used as the end closure for a large variety of cylindrical pressure vessels. These heads have a dish with a fixed radius (CR), the size of which depends on the type of torispherical head. The transition between the cylinder and the dish is called the knuckle. The knuckle has a toroidal shape.
The complexity of volume cylinder calculation depends on the plane layout cylinder. The horizontal plane position will be more complicated than the vertical plane.
The volume of a vertical cylinder is an area of the circle multiply by the height cylinder.
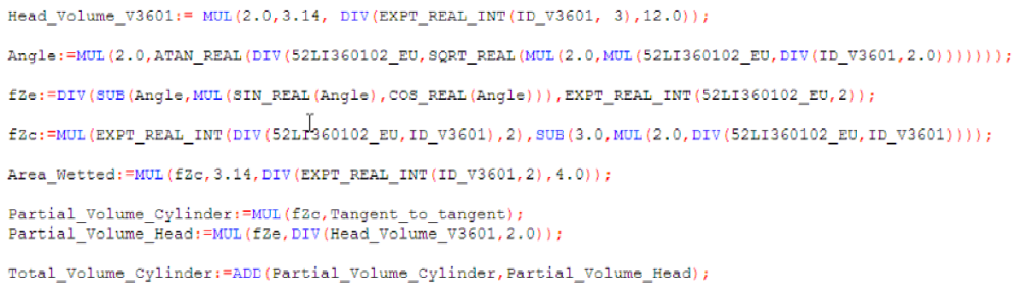
Cylinder Volume = pi() x ID2/4 x h, where pi()=3.14 ………………………(1)
In the example, there is no shape of the head. If the head appears whether elliptical or hemispherical. Then the volume is added to the cylinder volume.
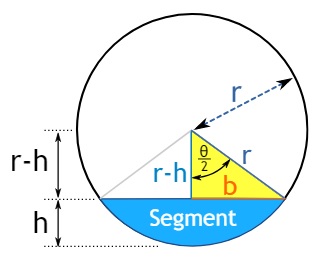
The horizontal will be different from the vertical. The horizontal cylinder will depend on the segment circular
It will give a totally different equation if the cylinder arrangement is horizontal. When the position is horizontal the volume of liquid will depend on the segmented circle. So the volume of the horizontal cylinder = segment circle x length of the cylinder.
Total heads volume (Hemispherical) = 2 x pi() x ID3/12 ……………………..(2)
or
Total Heads Volume (Elliptical) = 2xpi()xID3/22.8 ………………………………(3)
Zc/Ze = h/ID ………………………………………………………………………………………(4)
Angle in radians = 2 x Atan(h/sqrt(2x(h x ID/2) – h2) …………………………(5)
f(Ze)=(angle-sin(angle) x cos(angle))/pi( ) ……………………………………………..(6)
f(Zc)= (Zc/Ze)2 x (3-2 x(Zc/Ze)) …………………………………………………………(7)
Area, m2 = f(Zc) x pi() x ID2/4 ………………………………………………………….. (8)
Partial Volume Cylinder, m3 = f(Zc) x tangent to tangent (L) ……………….(9) Partial Volume Heads, m3 = f(Ze) x Total Heads Volume/2 ……………….(10)
During the offloading, the amount of liquid of a specific well could be determined by the following equation general mass balance.
Based on the general mass balance
(Vin – Vout)/dt = dV/dt
Vin/dt = dV/dt + Vout/dt
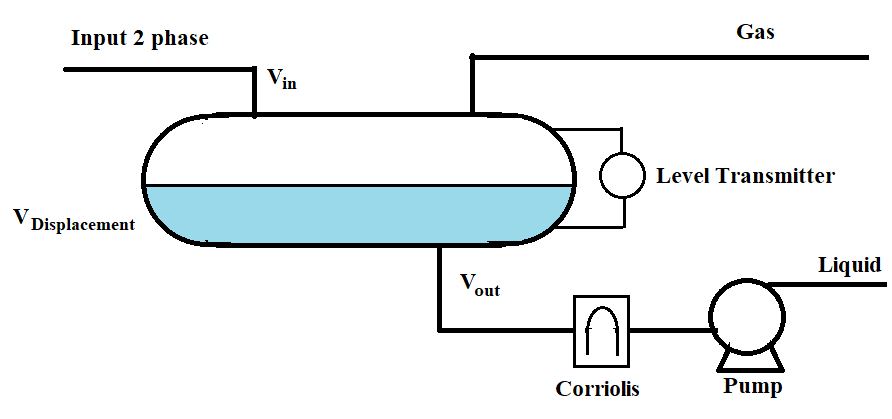
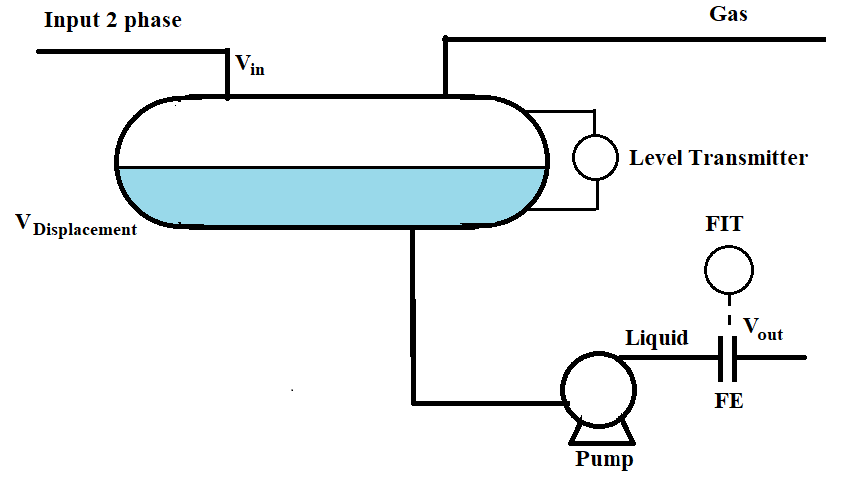
Vout/dt is measured by a Coriolis flowmeter using a totalizer.
dV/dt is displacement volume.
dt is period of start offloading and stop offloading
As the configuration above, there are several cases to calculate the volume of liquid in the vessel. It depends on the instrument sensor available on the vessel KO drum.
There are two ways to calculate
Manual Calculation
The manual calculation is performed by observation and data record. Data gathered will be further input into a spreadsheet.
The volumetric flow rate of inlet liquid could be calculated manually on a spreadsheet or automatically by the operation team.
Automated using PLC
The automated calculation is using program PLC, by pressing start and stop push button on HMI.
IV. 1 Volumetric Flow Rate Outlet
The interval time could be determined from level LAL as start pump and LAH as stop pump.
Using totalizer from Coriolis flowmeter. This method usually accesses by an operator on the display of the Coriolis menu. It requires operator intervention.
Before starting the totalizer it should be reset. The additional feature start-stop totalizer from the control room or local HMI (platform) is not giving major advance since activity offloading requires a standby operator. Start and stop automatically will give a better estimation of period offloading.
Instead of using analogue 4-2-mA to retrieve volumetric flow rate, the Coriolis should use serial (RS-485) connection as slave and master to the PLC. PLC could send command start and stop.
Schematic of Vessel with Coriolis flow meter to measure volumetric flow rate
If creating a connection requires a cost, the totalizer could be created on the PLC program.
The other schematic could be as bellow
Schematic of Vessel with differential pressure (dP) flow meter to measure volumetric flow rate
If the flowrate as seen above. Totalizer is created on the PLC program. Most of PLC have function totalizer on the libraries.
The method is same, start and stop totalizer is control by liquid level.
IV. 2 Displacement Volume of Vessel KO Drum
Displacemnt Volume is calculated using level measurement – Average height liquid in certain interval time.
Pump is start automatically in low level
Pump is stop automatically in high level.
By conversion of volume, volume displacement as stated in equation …(11)
The equation could be put on the PLC in order to synchronize the start totalizer on outlet vessel KO drum.
IV.3 Volumetric Flowrate Inlet as Volume Tubing
Since volumetric flowrate and displacement volumetric flowrate have been determined, they can both be programmed in PLC.
Volumetric flowrate inlet represents the amount of liquid (volume tubing)in a certain well during offloading.
Vin/dt = dV/dt + Vout/dt
Vin = ( Total Volume (horizontal) Cylinder + Totalizer recorded) x period offloading (period of start and stop offloading)
Business upstream facilities are focusing on exploration. In offshore exploration, there are platforms to evaluate the well performance and guard the safety shutdown of a wellhead.
Offshore platforms have been fabricated to accommodate specific well effluent at the first stage – preliminary treatment before sent to onshore or processing facilities to meet the gas parameters and properties based on the initial contract agreement.
Nowadays, offshore platforms could be monitored remotely. Each un-manned offshore platform is connected to form networking as wide area networks. It is similar to Headquarter inter-networking to the branch office. The network type between offshore platforms is a wide area network (WAN). The offshore platform is geographically dispersed. It requires high-speed circuits leased from a telecommunication provider to facilitate connectivity data transactions between platforms.
The physical network between offshore and onshore platforms is using radio use a broadband wireless network. Thus technology radio, networking and Internet Protocol (IP) routing eliminate barrier data monitoring.
The Integrated Control Safety System depends on the required safety and process. Typically Integrated Control Safety System (ICSS) in offshore platform comprises
Human Machine Interface (HMI)
Process Control System
Safety Shutdown System
Fire and Gas System
The 3rd party devices such as MPFM, sand monitoring, etc.
In the Company network, the network will be divided into two data networks i.e., Enterprise network (Office Data System) and Industrial Information System. Each company has different policies and rule to define segregation between industrial network and business network. The Enterprise network will interface to the office company. The segregation adheres to Open System Interconnect (OSI) Model. Based on the OSI model, to support the offshore remote platform application such as Industrial protocol, Office, and Audio/Visual it would use at least 2 routers. To segregate between router, local PCS router, and Firewall before it passes to the Office router.
The enterprise network is logically segregated from the industrial network.
The complexity of telecom facilities depends on the requirement of the User. It means business network and industrial network is exists. Department to handle business and industrial is slightly different. Certain offshore platforms Voice over (VOIP) phone including could send an email and use office application. Often unmanned offshore platform is equipped with CCTV.
II. BACKGROUND
Modification on an existing platform which is often called brownfield projects requires a holistic understanding of the existing control philosophy. The understanding is expressed and translated to document feasibility or adequacy studies. In, early-stage identifying options and methods are responsible for every discipline engineer. Each option will have a different impact and intertwined with other disciplines. That is why the pre-FEED (Front End Engineering Detail) is conducted in the early stage. In the pre-FEED study, the engineers must closely work with the other discipline to identify options or methods that could optimize the modification.
The project follows the existing system. In an example of modification because of additional process facilities, skid comprises a unit control panel for instrumentation package. Integration require adapting to the existing system such as topology system network, power actuation (hydraulic or pneumatic), and safety shutdown system.
This technical article of the case study shows the idea of regular basis task for IT team, would bring high advantage to reduce cost in the development project.
If we are using the existing system philosophy network topology, the IT team mostly will not involve in the project. As in a typical company organization, all related to networking is usually it is under the IT department. Thus any idea related to inter-networking should initiate from instrument & control discipline engineer.
Therefore, it will evoke IT team involvement. Instrument and control systems should have basic knowledge of networking. If we did not request it the IT team wouldn’t aware of the project requirement. Often simple task in other discipline will bring lot advantage to other discipline.
Classification of instrumentation package units usually unique among the Company.
The identification boundary of the instrumentation package could start from dependencies of
Junction box,
Power source
Skid
Cable trays
Power source
Unit Control Panel Specification
III. UNIT CONTROL PANEL (UCP) INSTRUMENTATION OF PACKAGE UNITS
III. A. IDENTIFICATION PROPOSAL NEW SUBNET.
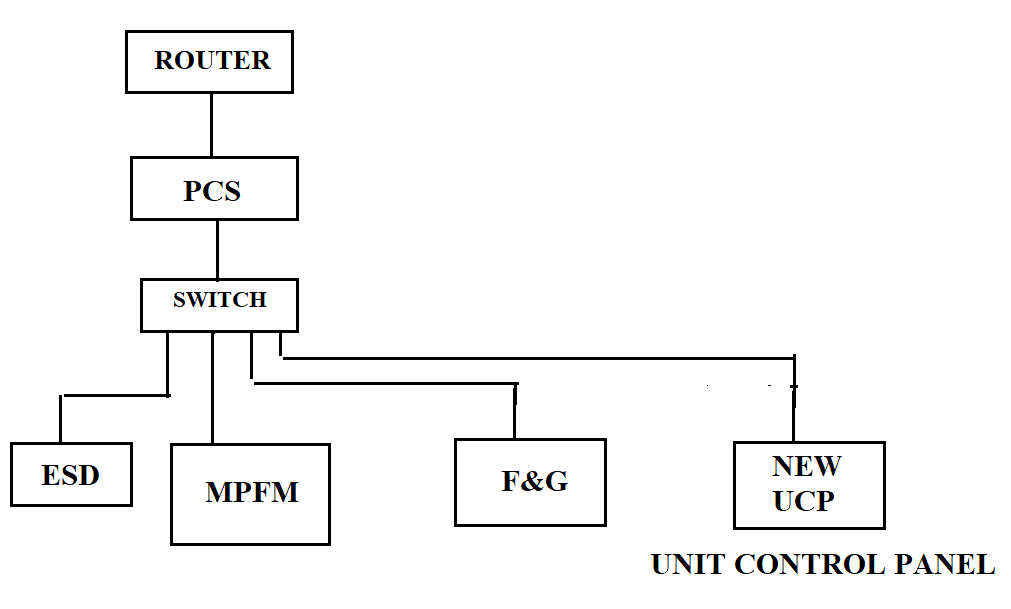
The Integrated Control and Safety System (ICSS) which monitors and guards the offshore platform is considered the ICSS supervisory. Any system supply with a unit control panel mostly will be under ICSS supervisory. The classification of the instrumentation package should be further identified by Company specification. However, full access to all package parameters shall only be possible from the Unit Control Panel (UCP).
Process control system (PCS) often as a repository for a package control system. Displays of monitoring and control presented in HMI get all the parameter information from PCS. It will then process further for alarm, trending, engineering unit scale, sequence of events.
The control room Supervisory Control and Data Acquisition (SCADA) obtain parameter data monitoring and control from the physical direct network connection to the onshore such as in star topology. However, the logical network connection between platforms for the information industrial system (SII) is ring network.
In this technical, I would like to go through one of the compressor projects in the offshore platform.
The compressor could be categorized as per independent system with a monitoring and safety system. It is connected to the existing industrial information network to perform monitoring and safety systems in form of a Unit Control Panel.
Identification option based on logical network and subnet, with the addition of a new instrumentation package complete with Unit Control Panel, therefore, there are two options:
Option 1, UCP connected to a local network with the same subnet. The option 1 could be breakdown into
Connected to PCS, where PCS as client and new UCP as server
Independent from PCS, it is logically connected to SCADA onshore.
Option 2, UCP separate from a local network with different subnet. This option is valid when there is no spare host IP available.
III.A.1 Typical architecture before additional UCP in offshore platforms.
Typical Control System Architecture
In the same subnet, the maximum host is determined by the selected class subnet.
This architecture uses a local network address. Each device has a unique IP. IP comprises:
Classful Addressing
Classless Addressing
The Local network addresses has the same subnet for all devices. Below are classful address. It is not used anywhere on the public internet, reserved for private LANs.
Class
PRIVATE IP RANGE Start Address
End Address
Default Subnet Mask
IP Class A
10.0.0.0
10.255.255.255
255.0.0.0
IP Class B
172.16.0.0
172.31.255.255
255.255.0.0
IP Class C
192.168.0.0
192.168.255.255
255.255.255.0
Example of Class B Network Mask
Netwwork Bits
Subnet Mask
Number of Subnet
Number of Hosts
/16
255.255.0.0
0
65534
/17
255.255.128.0
2
32766
/18
255.255.192.0
4
16832
/19
255.255.224.0
8
8190
/20
255.255.240.0
16
4094
/21
255.255.248.0
32
2046
/22
255.255.252.0
64
1022
/23
255.255.254.0
128
510
/24
255.255.255.0
256
254
/25
255.255.255.128
512
126
/26
255.255.255.192
1024
62
/27
255.255.255.224
2048
30
/28
255.255.255.240
4096
14
/29
255.255.255.248
8192
6
/30
255.255.255.252
16384
2
How many devices could in one local network?
The answer is based on the host portion defined by the subnet mask.
Combination of IP address and subnet mask will determine
Network Address.
Identifies local network
Host Address
Identifies unique devices on a network.
Broadcast Address
Only able to broadcast on the network.
A maximum number of the host IP address will be substracted by broadcast and network addresses.
Below are illustrations Network portion and Host Portion using IP Class B. The different network portion will result in the 2 devices could not communicate
After changing the subnet mask, the 2 device will turn into one network
The two devices should be in the same local network if the network portion is different it will not connect. Either changing the IP or subnet mask to obtain the same network portion.
Changing the subnet will enable the IP group in one host portion. The most practical work will use different IP in the same class with the same subnet mask. This is the most selected.
III.A.2 IP and subnet mask
Most on one platform deploy using IP Class B and IP Class C. IP Class B have more addresses per network than IP Class C. Between routers could use IP Class A.
Before we go further, why do all platforms are not connected to the same network? In practice, each platforms has dedicated PCS routers. Each platform has its network.
The SCADA system in this example Experion R210B has a maximum of 100 controllers (RTU’s). Why does it need to create a subnet if the SCADA could accommodate all controllers in each platform?
So, what happens to a large network with no subnets? Every computer would see broadcast packets from all the computers and servers on the network, resulting in the switches having to move all that traffic to the appropriate ports. This leads to increased congestion, reduced network performance, and slower response times.
The SCADA system on onshore and offshore PLCs is deploy using IP Private address.
The private IP address of a system is the IP address that is used to communicate within the offshore platform. Using private IP data or information can be sent or received within the same network.
The public IP address of a system is the IP address that is used to communicate outside the network. The public IP address is assigned by the ISP (Internet Service Provider).
III.A.2.a. Physical Connection schematic of new UCP.
The logical connection will comprise of :
Additional Unit Control Panel
PCS as a client while unit control panels as server
Independent from PCS and direct connection to DCS/SCADA on onshore. If the host number still could accommodate new UCP it will use the local network (same subnet) unless the spare host number is not available, it should create a new subnet for a unit.
Both have advantages and disadvantages. It is engineer judgment to choose the best requirement although certain Company has dictated preference on the Company Specification.
III. A.2.b.1. INDEPENDENCY.
Independencies UCP network by means the logical network of UCP is connected directly to SCADA instead of PCS
Besides the advantage and disadvantage, since it will separate the network. It should perform other assessments of the new system is independencies between two systems. The safety shutdown between two systems could be performed by using hardware.
This is not an exhaustive comparison, only based on the writer knowledge and experience.
Do exchange data occurred between the two systems. For example, if some equations or calculations that require data from one system to another.
Do PCS controlled data UCP?
Item
Same Subnet Mask
Different Subnet
Advantage
– It doesn’t require additional configuration on the existing network.
– It will not involve any IT department. Doing this hidden cost. It implied high-cost engineering.
– Enable to form typicality address. Data exchange table between LLP compressor and DCS onshore.
– Don’t interfere with PCS, so it will not add consume any memories to the PCS
– Reduce man-hours Reduce repetitive document such as data exchange table
Disadvantage
-Difficult to create typicality. Each platform will be a unique address for the data exchange table
– Possibility to add a new router as a consequence HMI will connect to the new subnet mask.
IV. NETWORK
IV.1. ROUTER
The purpose of a router is to route a device/station to a different network, which is forwarding traffic to its destination based on its Layer 3 network address.
A router uses information contained in the internet protocol header to make various decisions; these decisions include
There are several selections of router interface. The interface connection is connected between two different networks
Serial, The router has 2 WAN slots that can host a single-port serial module or multimode 3G module and support the following combination
Ethernet, RJ-45 Port
Fast Ethernet,RJ-45 Port
Giga Ethernet, SFP Port
Cisco 2621XM wired router allows you to join wireless devices through its WIC slots, which expands its functionality. This wired router comes with two Ethernet ports, one network module slot, and two WIC slots. Its built-in Ethernet card, on of the Example NM-2FE2W Module provides two Fast-Ethernet interfaces for use with copper media, in addition to two Wan Interface Card expansion slots. Ideal for a wide range of LAN applications, the Fast Ethernet network modules support many internetworking features and standards.
Cisco Packet Router is one of simulation tools contain information various module interface.
IV. 3. DIFFERENTIATING ROUTER APPLICATION
An industrial information system network is deployed using a protocol such as modbus TCP, EthernetIP, or Profinet. ModbusTCP, EthernetIP, and Profinet will have different OSI Layer Models. However, the industrial information system network is using the same router.
OSI Layer Model consists of:
Physical – Layer 1
Link Layer, consist of Header and Body – Layer 2
Network layer – Layer 3
Transport layer – Layer 4
Session – Layer 5
Presentation – Layer 6
Application – Layer 7
In offshore platforms, a minimum router is 2 router.
Router PCS
Router assign for Telecom, such as CCTV and VOIP. It has a different OSI layer model
Application Layer Protocols
Data Transfer Protocols for email
Audio/Visual Protocols for CCTV
a specific network protocol is being used to manage and transfer the data.
The destination port number is in the segment header. Transport Layer 4
Application Port
Port Number
HTTP
80
HTTPs
443
FTP
20, 21
SSH
22
Telnet
23
Modbus TCP
502
IV. 4. Network Topology
Network Topology is using a token ring network. The ring network is selected to increase the availability. Different companies have different regulations. Certain companies decide to shut down (no-man)platform within 24 hours. If this period the maintenance could not Lose network could mean shutdown in 24 hours.
IV. 5. IP Routing
A router opens the IP packet to read the destination address, calculate the best route, and then send the packet to the final destination, and if the destination is in a local network, it sends the packet directly to the receiving computer.
IP routing is expressed in router. There 2 router consists of:
PCS Router
Office Router
Most likely by design among offshore platforms will form ring network topology form in synchronous digital hierarchy backbone network to increase the availability. However, network topology between onshore and offshore having a physical star topology network through point-to-point wireless and ethernet radio. A point-to-point network is a common method for connecting a remote site to another site.
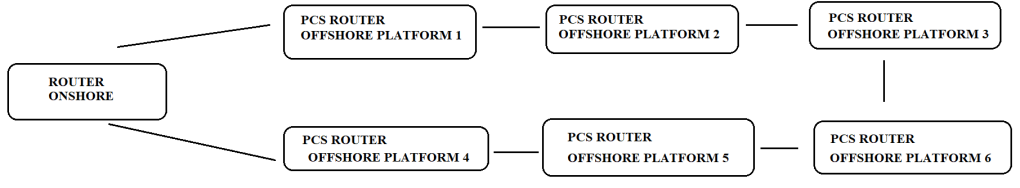
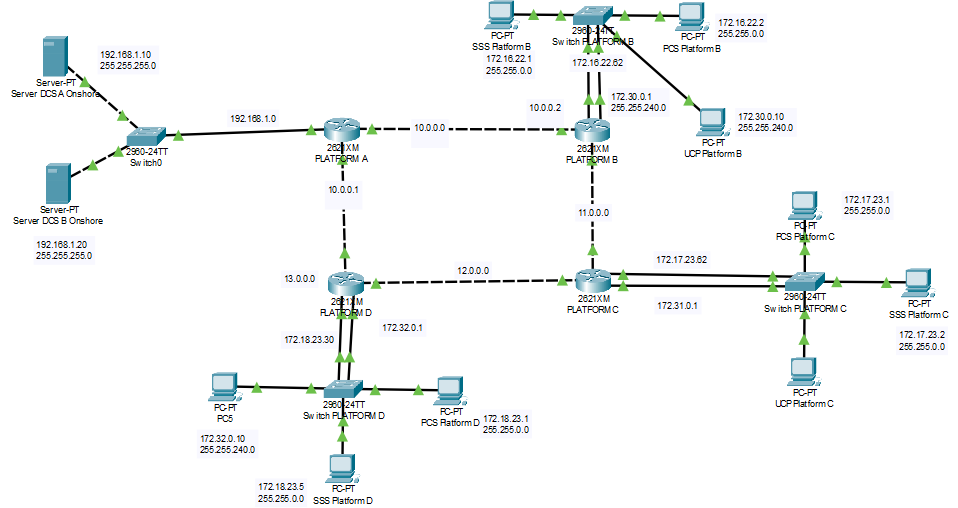
Below are the PCS router network before the modification
Each offshore platform is the host network. So if you have 8 platforms then you have 8 host networks. With, a new subnet mask in the same platform it means the new device will be a new host. Data exchange between two systems to demonstrate a level of independencies between two systems.
IV.6. Interconnection logic network
This modification will perform in each routing table on the router both on the onshore and offshore platforms. Below is an illustration that adding a new subnet will reduce the cost of the man-hour project.
Routes are used to determine where the IP packet is sent to a router on the network. The interfaces on the router write the network addresses that are connected to them in their routing table. Therefore, the router decides where the IP packet will go according to the records in the routing table. A static router is manually configured to define the path, therefore whether new subnet or new IP in the same subnet, each router should be configured to define the path.
There are 3 types of routing:
Static routing, Static routes are user-defined routes that cause packets moving between a source and destination to take a specified path. Static routes provide fixed routing paths through the network. They are manually configured on the router. If the network topology changes, the static route must be updated with a new route. Static routes are private routes unless they are redistributed by a routing protocol.
Default routing, also known as gateways of last resort, are used to route packets that are addressed to networks not explicitly listed in the routing table
Dynamic routing, In dynamic routing, the network protocol adjusts the path automatically, based on network traffic or topology. Changes in dynamic routes are shared with other routers in the network
The router could be configured default, static or dynamic. Mostly offshore platforms will utilized combination of static and dynamic. The selection is based on several judgments and conditions. The ring network between offshore platforms is using static routing., static routing is commonly deployed. In terms number of offshore platforms, it is not a large network. Static routing is a process in which we have to manually add routes in the routing table, therefore no bandwidth usage between routers. It adds security because the only administrator can allow routing to particular networks only. Dynamic routing tables created using routing protocols. These protocols are used to communicate between routers proving the information about the most efficient way to route data. Below is an illustration of an existing ICSS network. The logical network is configured manually in each router to define the path
IV.7. STATIC ROUTES
This study case uses a static router. The background reason for using the static routes is suitable for static compare to dynamic.
When to use static routes
Static route can be used to:
Reduce the number of routes advertised by a router.
Create a backup route if the primary route fails.
To connect a device to a specific network
To connect a stub router or a stub network.
Advantages of static routing
It provides easy routing table maintenance in networks.
Static routing consumes less bandwidth when compared to dynamic routing as no CPU cycles are used in route calculation and communication.
Because static routes do not advertise their route over the network, it results in better network security.
Limitations of static routing
In large networks, configuring and adding a static route to the routing table is very difficult.
Configuring static routes requires background knowledge of the network topology by the network administrator.
A static route is error-prone.
Below are the illustration of routing to ensure the idea is working
Below is the example of using dynamic routing
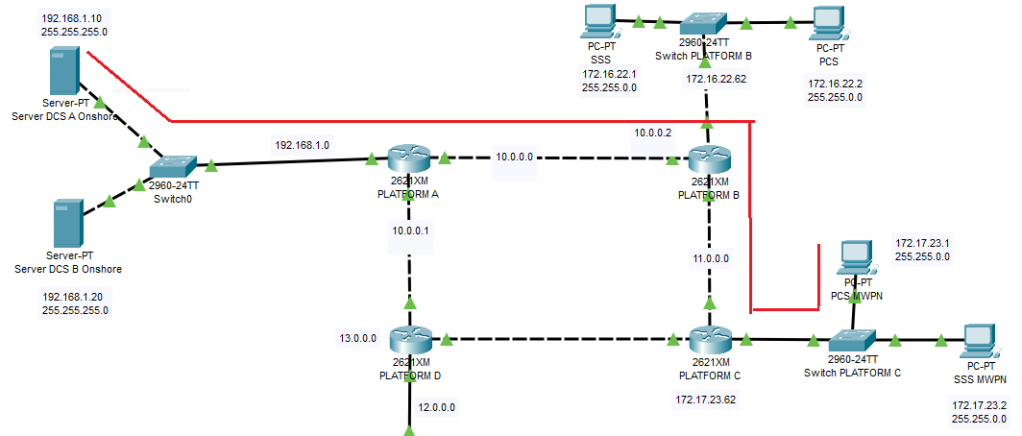
As seen the red highlight routing, to create connection from Server DCS A onshore to PCS Platform C, the router .
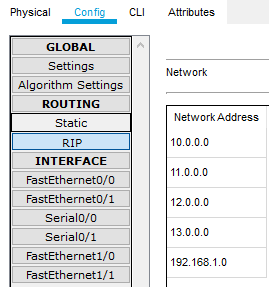
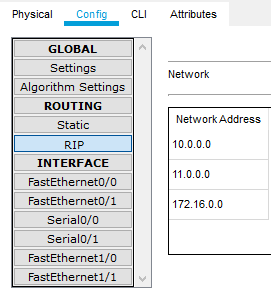
Routing Information Protocol (RIP) is a commonly used routing protocol in small to medium TCP/IP networks. It is stable protocol that uses a distance-vector algorithm to calculate routes.
RIP declare on the router Platform A
the network related to the path
192.168.1.0
10.0.0.0
11.0.0.0
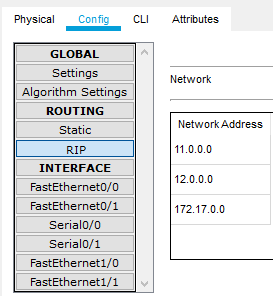
RIP declare on the router Platform B
the network related to the path
10.0.0.0
11.0.0.0
RIP declare on the router Platform C
the network address related to the path
11.0.0.0
172.17.0.0
Below are the illustration if using new subnet mask for the UCP. One more interface port is utilize.
IV.8. HMI to new UCP
Often a UCP has a dedicated HMI, it represents the detail of the package system. This includes start-up sequence and start-up and maintenance inhibit.
Part of the display will be copied to the HMI process platform. It is necessary since, during the start-up process, the operator has to ensure other parameter processes before running the package system. In normal operation mode, it will be used to monitor the other process and package system in stable condition.
In HMI, new IP will be added to retrieve data from UCP.
The UCP is using a new subnet mask. The connection HMI to UCP could deploy using VLAN Routing. VLAN Routing is creating a segregation connection from HMI to UCP. The additional UCP will add the server to the HMI
Connection HMI (client) and PCS (server)
Connection HMI (client) and UCP (server)
Inter-VLAN for HMI could be created if UCP is using new subnet mask.
V. THE COST REDUCTION
Cost reduction is due to typicality. The 3rd party system package could be typical on all platforms.
Each platform will have a uniform P&ID including the tag
Each 3rd system package could have the same Modbus address in all platforms cause it doesn’t depend on an available address on the PCS existing.
In the onshore control room, DCS address could be only distinguished by the Modbus slave based on the area while the numbering order will be same.
IV. 1 Engineering document
If there are 5 offshore platforms, there are repetitive engineering work that could reduce such as
P&ID for instrumentation package could be typical instead of each platform.
Modbus exchange data table could be typical instead of each platform.
IV.2 Human-Machine Interface (HMI) Modification
Because of additional UCP, the local HMI shall be modified as well, the modification will include an additional page, Modbus address, and new controller.
Display UCP could be similar on all platforms. Therefore, if HMI is identical in each platform, it will give more advantage to the man-hour.
Modbus address order could be the same/similar for UCP in all platforms.
IV.3 Process Control System
Since SCADA onshore has a direct network connection to the unit control panel, therefore, no major interference with PCS. It will not consume memory.
IV.4 SCADA
As they do not connect it to the PCS router, the address for retrieve information could be in the same order on each platform. The addressing could be the same, the difference only the IP for each platform. By doing this, the only difference is the area numbering usually found on the front of the tag name.
in example 11-PT-001, 12-PT-001, and 13-PT-001
11 = Area A
12 = Area B
13 = Area C
VI. CONCLUSIONS
The magnitude cost of reduction is not presented in this article. This is a study case to reduce the cost that this modification could reduce labor force, repetition document during basic engineering but the writer could not exactly quantify the magnitude cost reduction.
Different Companies may use a unique approach. Discussion with technical authority Company. It required a project management team to achieve the goals.
The scope of this project was to obtain tangible efficiency turbines through mass balance water input and output by the deployment of flow rate sensor from various point measurement inlet and outlet at Water Treatment Plant for Power plant (Coal). The application was for monitoring only. No control sequence or safety shutdown system involves.
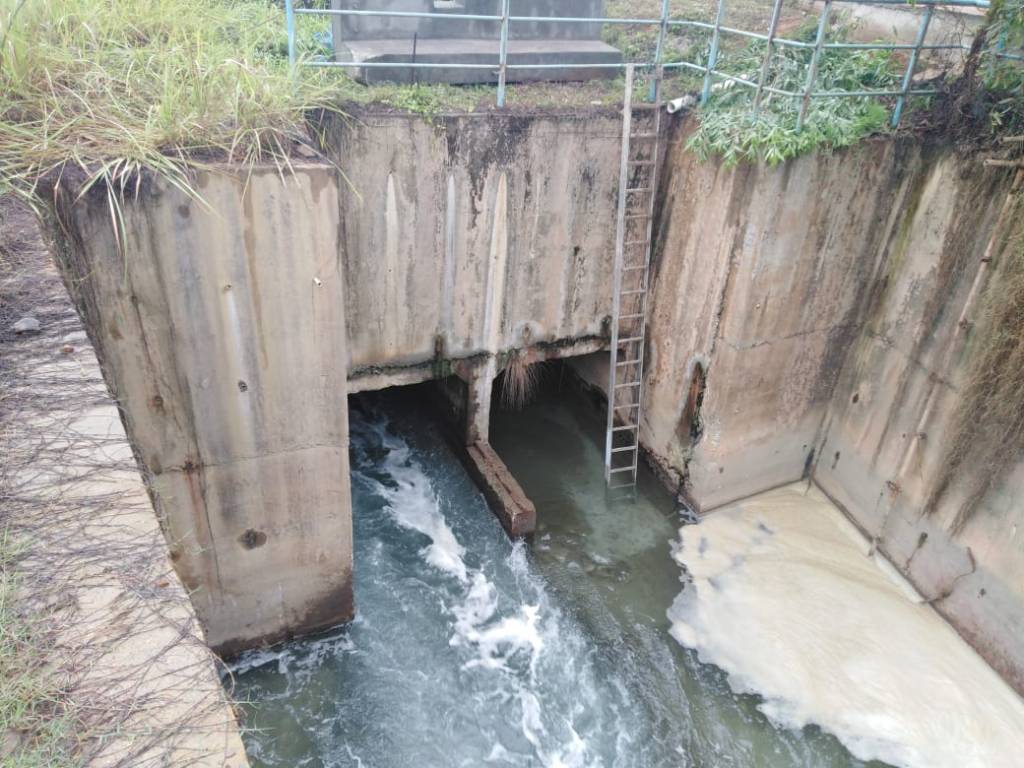
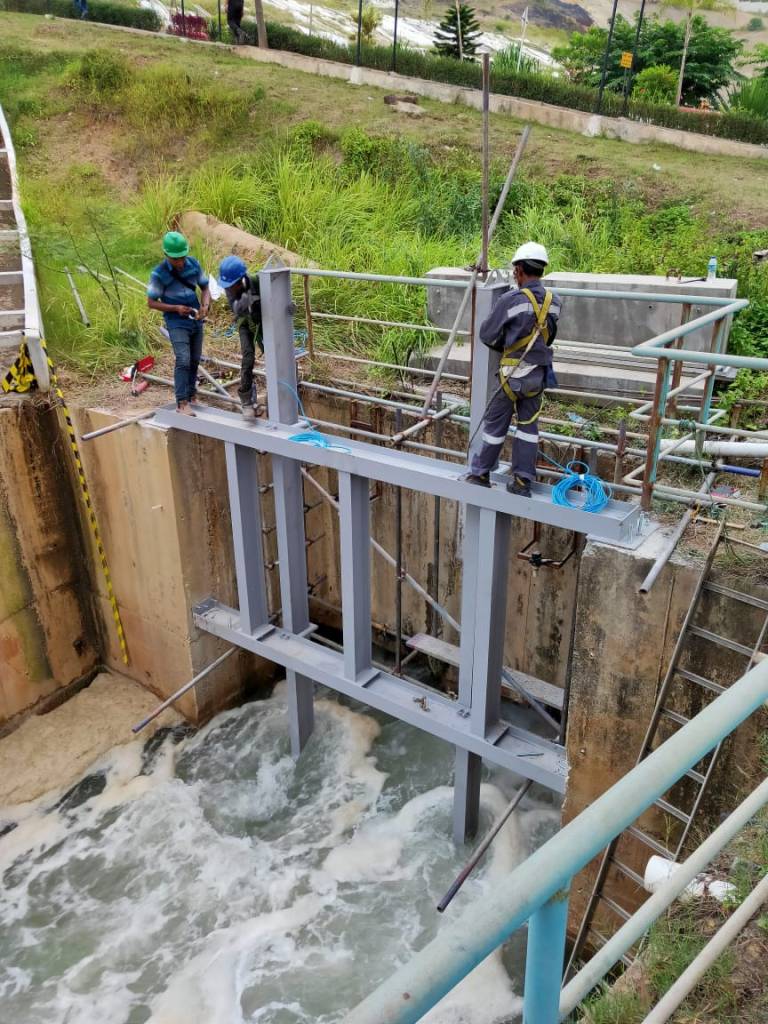
Among these flowmeters, a specific case that drains our attention. It was solving the open channel flowmeter on the outfall unit from the condenser. The water cycle operation is never expected to shutdown, either 2 x 50% or 2 x 100% operation of power generation. This situation contributes to the complexity of hydraulic structure/weir installation.
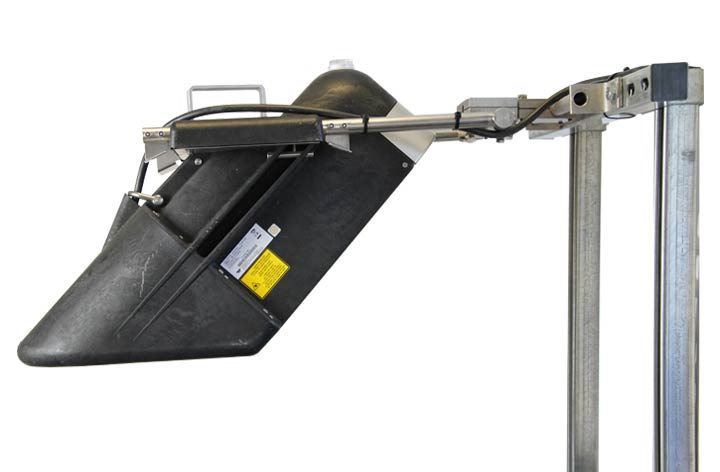
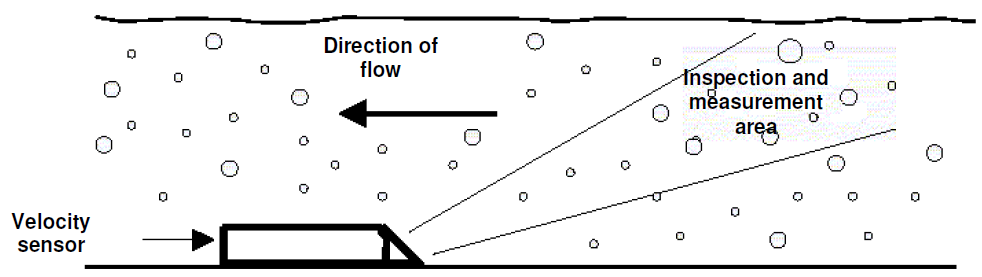
An open channel flow meter is not frequently part of the scope project not many as flow meter carried in closed conduits that flow completely the piping system. In this article, I would walk you through to capture the problem encounter during the installation hydraulic structure of open channel flow meter. In the end, it will influence the selection sensor for open channel flowmeter to enable the installation and to eliminate the possibility of failure.
Weir, as seen in the construction design, is essentially a dam built across an open channel over which the liquid flows. It simple based on the design especially when selecting rectangular weir without end constructions. I overlooked the weir thickness requirement and installation method. The installation method is so crucial in order to place the weir as a hydraulic structure.
The requirement thickness should be calculated by a structural engineer in regard to force exerted on the weir. Moreover, the installation method should review by construction engineer since the water flow could not be stopped, only in certain circumstances, the water flow will undergo low flow rate.
The other difficulties factor is we don’t have structure or installation engineer, so we fully trust the responsible for structural and installation scope to the contractor. It was not all the contractor’s mistake since we didn’t request any calculation and installation procedure document.
All the explanation below is related to the projects.
II. PLC and HMI
I was in-charge for programming, designing, and configuring both Programmable Logic Controller (PLC) and Human Machine Interface (HMI). Although there is A comprehensive guide selection of PLC is available in relevant details such as IEC 61131-1 and IEC 61131-2.
In common practice especially for PLC package in an existing plant, PLC is selected based on, as follows:
Hazard and operability study (HAZOP) to identify the requirement of safety integrity level for the PLC
The capability to cope the application.
Project budget.
Certain population PLC on the User/Company premises.
Service availability PLC product on the country.
In this project, the PLC selection was toward to no.4 besides the project budget. It was agreed to use PLC Simatic S7-1200 CPU 1214C. S7-1200 is sufficient for the specified application. The main application was to monitor flowrates on different locations at demineralize water systems. There is no control and safety requirement for the shutdown process.
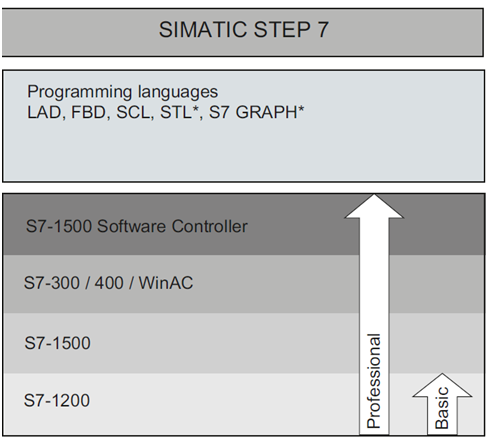
Nowadays, PLC developer is competing to create integrated automation software with one engineering environment and one software project for all automation tasks. Siemens has built an integrated software portal named as TIA portal. This is a Control Engineering 2012 Engineers’ Choice award winner. As a user I admit, it was really convenient and easy using Step 7 professional and RT advance. However if you are a new learner, it is recommended to read the guideline to familiar the program blocks. Selection engineering software depends on the controller model. Actually, STEP 7 Basic is sufficient. However, since the plant has various Siemens controllers into it is decided to use STEP 7 Professional.
Whether it’s the inexperienced or experienced writing the PLC program, simple ladder logic, and a step sequence is often the best solution. It was developed using ladder logic and function block diagram, Step 7 utilize grouping the ladder logic name as a network.
After deciding the PLC brand, there are several factors to be considered such as.
Power supply quality
PLC Program
Signal transmission
Conformance to Hazardous Area
II.1 Power Supply Quality
AC voltage is the main source power, vendors provide module AC to DC with various power wattage. Each power module will supply PLC rack. It will power the I/O module either through the back plane or cables. Most cases, field instrument is using dedicated AC to DC power supply. Power supply quality is important for a steady condition for the I/O module either analogue or digital module.
It should carefully evaluate when PLC power supply is the same source with an inductive load such as a motor. Power quality should be one of the considerations when utilizing 4-20mA analogue input. Power quality refers to the ability of electrical equipment to consume the energy being supplied to it. A number of power quality issues including electrical harmonics, poor power factor, voltage instability and imbalance impact on the efficiency of electrical equipment. Equipment instability and failure.
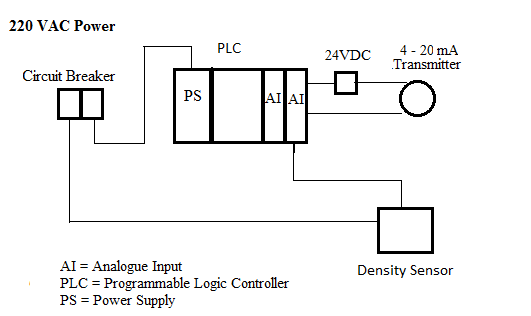
Below is a simplified interconnection diagram, one of example when power quality could interfere 4-20 mA signal and flickering digital signal. The symptoms analogue fluctuation and flickering always occur whenever the density sensor connected to the AI Module.
At first sight, we suspect it comes from inductance coupling between cable AC and analogue, digital wiring (24VDC). Although the arrangement cable inside the cabinet has been separated between AC and 24VDC. The distance is adequate to minimize inductance coupling using a cabinet with a width of 800 mm.
We also suspect from grounding issues. We have to provide proper grounding for the power supply PLC and power supply converter 220VAC to 24VDC. Since not all companies segregate between instrument grounding and power grounding only equipment with source 220VAC is connected to dispatch grounding.
In the end, we figure out that the problems are caused by power quality due to harmonics. So we decided to use AC to AC converter. It solves the problem.
II.3 PLC Program
PLC program of this project consists of:
Scaling complete with simulation input
Alarm (High only, High-high provides but not use since no emergency action applied for flowrate)
Totalizer
This program is a standard basis for a flowmeter. The scaling and alarm function block could be combined (as seen in figure 1). The function block is created by user from the basic function block.
Not all user function block requires developing from scratch. Siemens has provided additional add-on libraries available on their website. One of the examples is Totalizer.
II.3.1 Memory Capacity
The size of memory capacity depends on several factors even the style of programming could affect memory capacity. Deciding memory capacity is vital when the plant is continuously extended or expanded.
The other factor of memory capacity as following:
The number of input-output, number of variables, constant, and contribute to consume memory IO.
System architecture with other devices.
The individual style programming and programming language.
The Complexity of the application. Scaling, mapping, and alarm are typical or standard program. One of the examples complexity programs could be is represented in the control loop method. Feedforward, Close loop, 2 degrees of freedom control etc.
II.3.2 Scaling 4-20mA to Engineering Unit
Raw value as a representation of 4-20mA could have a different minimum or maximum value among the modules. The value to be determined based on the function purpose. Below are different full-scale ranges among the module.
The engineering unit scale between PLC and transmitters should be the same. Thus, a linearity relation between 4-20 mA and the engineering unit is created. 4 mA as lower range value and 20 mA as upper range value.
However, you need to decide the unit and scale to be sent from the transmitter.
In the example of a Magnetic flow transmitter, the information conveyed in 4-20mA could be presented in either velocity or flowrate. If you choose a velocity, in consequence, the flowrate equation should be created in PLC program.,
If the engineering unit scale between PLC and flow transmitter is different the linearity between the devices will be different. In addition, errors contribute to non-linearity. There is four error that contributes
Zero
Error
Span
Error
Linearity
Error
And
the combination above
In case
this happens, the display in the transmitter and HMI will be different.
II.3.3 Totalizer
Totalizer is used to determine the accumulative flowrate during a certain period. For example, “in the last 60 seconds, there have been 30 gallons of water flowing by the sensor.”
To obtain consistency accumulation during certain periodes, Totalizer should be considered as an interrupt. Thus regardless of the complexity of the program. It would give high priority to maintain a consistency time period.
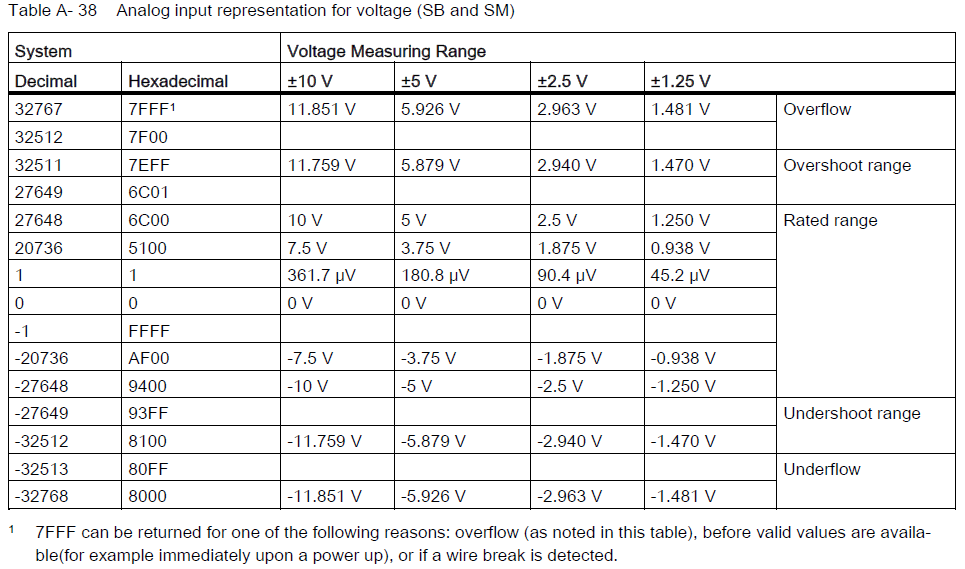
One you should aware of when implementing Totalizer in the PLC program. The raw value should be limited for instance 0 to 27648. Over and under this value, it should be identified as an error. The error should not consider as a value in totalizer. It should hold totalizer or give input value 0 on the totalizer function block. Over and under range, the value could be used to identify short or loose cable wiring.
II.4 Signal Transmission
Selecting signal transmission to convey the information Besides conventional 4-20mA, the other option is to use HART. HART protocol offers a number of advantage however there are drawback should be considered.
Much technical literature is available to explain HART protocol in detail. The compatibility between HART and 4-20 mA wiring. Field transmitter complete feature HART enables to ease of calibration system.
Several advantage when using HART Protocol as following :
Not necessary to provide scaling analogue function block
Totalizer is not requiring defining the PLC program. Totalizer is available on certain field instruments. PLC will send a command to start and stop the Totalizer.
Besides the primary variable, the other parameter could be obtained. Other parameter known as a secondary variable, tertiary variable This variable could retrieve by three classes of HART commands:
Universal commands
Common Practice commands
Device-Specific commands
If there were concerns about hazardous areas, HART protocol is claimed to be more intrinsically safe.
Therefore, it is depicted that HART has an advantage over conventional 4-20mA. There are several things to be considered in order to use HART
Do they possess Asset Management
SystemCPU (processing unit) and AI cards should be compatible. For Siemens PLC, HART is using ET200. This series is far compared to the S7-1200 series
Version to be check
Selection of cabling system – Peer to peer or multi-drop.
Installing or enabling resistor 250 ohm. Scaling is not required even you could retrieve 3 data parameter simultaneously named as
PV; Primary Variable
SV; Secondary Variable
TV; Tertier Variable
II.5 Hazardous Area
Mostly, PLC is located in a safe area i.e. technical room, meanwhile, the field transmitter is located in a hazardous area. Hazardous area certification for field transmitters should be inline with the wiring. When using conventional 4-20mA, the wiring in the hazardous area needs to be check. Mostly, when the PLC and the field transmitter have different hazardous areas.
III. HMI
Human Machine Interface is a user interface or dashboard that connects a person to a machine, system, or device. It is stand-alone and independent from the existing DCS system.
The selection of HMI is based on the architecture of the application. The architecture of HMI/SCADA will determine the license to be purchased. There is more detail, for selection HMIa . Below are several overviews
Independent/Stand Alone. The license either development or runtime license.
SCADA Based, If SCADA is selected next it to decide the sharing data., DDE Server, OPC or combination
SCADA based definitely require development license
Web client
This
project is using Wincc RT Advance
There is an option based on feature and scale-able of
Basic
Comfort
Advanced
Professional
The reason to deploy Wincc RT Advance it has minimum features to covers the flowmeter application. In general, the HMI consist of
Representation displays such as P&ID. Symbol and coloring mostly based on the industries. The company could also produce specification and regulation for symbol and coloring
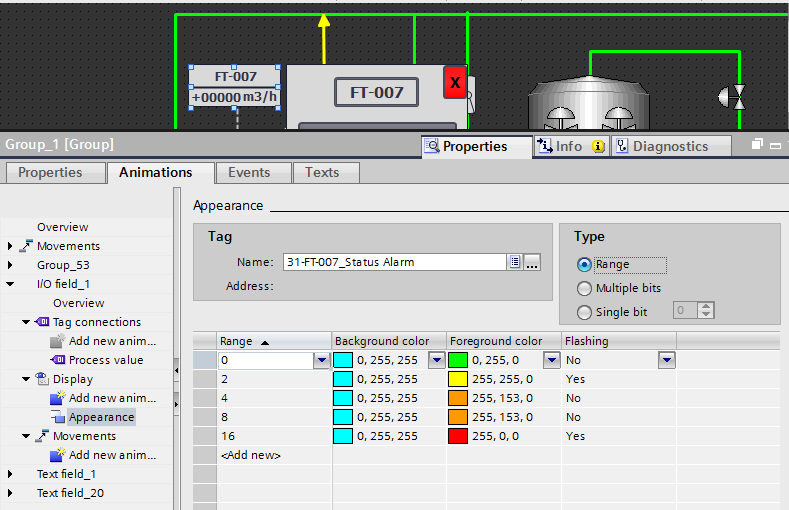
Alarm management, it will be guided through ISA. Alarm animation is important for operator to identify situation.
Inhibit
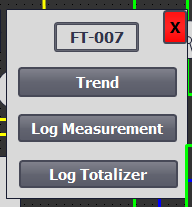
Logging, (logging of process values and alarms). Please be aware logging Options for WinCC runtime Advance
Trending, Individual trending each flow transmitter
III.1. General Alarm
General Alarm has different tone for specifics events. Indeed, it is different between Company. To notify all attendant in the plant. Each area is equipped with annunciation.
This project didn’t integrate with existing General Alarm
III.2 Alarm
In industries where process hazard analysis results in minimum SIL 2. It requires 2 systems separated. Process Control System and Safety shutdown system.
When these systems exist. Grouping occurrence of alarm based on the system. PCS covers high and low alarm while SSS generate alarm High-high and Low-low. High-high and low-low alarm have consequence action to the process closing the valve or stopping the pump.
As stated, this application only for monitoring there is an alarm rule that could be waived. No intervention by maintenance personnel is required. High-high and a low-low alarm is not mandatory thus reset alarm through acknowledge is not mandatory either. The alarm logging is available.
The other feature does not require are
Maintenance inhibit
Start-up Inhibit
III.2.2 Alarm Animation WinCC
Alarm animation is important for an operator to know the condition of the plant. Usually, each company has different specifications for color and shape to animate the process plant.
It could be similar to the same type of business or industries.
I found that the way to represent alarm animation assign to a variable on WinCC advance is kindly different from other software HMI. Usually, the shape contains 2 tags or 1 structure tag.
Usually, I use structure to group alarm for one tag i.e.
PT001.HH with set point 90% of the maximum range
PT00.HH with set point 70% of the maximum range
PT001.L with set point 30% of the maximum range
PT001.LL with set point 10% of the maximum range
The other way is to generate dedicated variable i.e
PAH001
PAL001
The alarm is discrete 1 or 0; True or False. Meanwhile RT Advance uses integer value to generate different level alarms. The way to generate an alarm on RT advance is kindly different from what I use on other HMI. RT Advance use integer value to generate different level alarms
Faceplate
A faceplate is a configured group of displays and operator objects. The “data exchange” with the display and operator objects contained in the faceplate is performed via an interface at the created faceplate. The properties of the used display and operator objects are assigned to the individual objects in the “faceplate editor”. Faceplates can be managed and modified in a central library.
This project use faceplate as seen below. No control applied on the faceplate. No universal standard for a faceplate. It is custom depends on the application. In this project, the faceplate consists of
Individual trend flowmeters
Individual log measurement
Individual totalizer
IV. FLOW TRANSMITTER
All flowmeter is connected to the new dedicated PLC and HMI. It is stand-alone and independent from the existing DCS system.
In a standard basis, selecting flowmeters usually based on the
Accuracy requirement (for fiscal service or not)
Type of fluid and other fluid parameters
Installation constraint. Equipment that can be reached for inspection, repair, or monitoring from permanent platforms is more likely to be inspected, calibrated, and replaced than equipment that requires climbing with a safety harness or scaffold.
There were 3 types of flowmeters used in this project
Vortex flowmeters, operate under the vortex shedding principle, where an oscillating vortexes occur when a fluid such as water flow past a bluff (as opposed to streamlined) body. Vortex mostly uses in application of steam.
Magnetic flowmeters, this type of flowmeter is very common for water service due to the dominant conductivity parameter.
The ultrasonic flowmeter as a secondary device. The ultrasonic level meter is not only used for the level meter but it could use as a parameter to determine flowrate of open channel water. The equation will be embedded in the PLC program. For this application, it implements for the open channel consist of culverts and open channel.
Each flowmeter has a different method to obtain the flowmeter value. Each will have a different equation.
In the case of open channel flowmeter, there are several methods. The primary device for ultrasonic flowmeters are:
Weirs
Flumes such as Parshall flumes, Cutthroat Flume
IV.1 Rectangular Weir
In the first design, we use rectangular weir for the simplicity design
Flow rate equation based weir method, Q = 6620(L-02.H)H1.5,
Where :
Q = flowrate
H = head on the weir
L = crest length of weir
K = constant dependent upon units
IV.2 Cutthroat flume
There is a similar method as Parshall flume named as a cutthroat flume. In this project, the cutthroat flume is applied to measure flowrate at sewerage as a primary device.
W=KW1.025Han = CHan
Q=free flow rate(cfs / m3/s)
K=flume discharge constant (varies by flume length/units)
C=flume discharge constant (varies by flume length/throat width / units)
W=throat width
Ha = depth at the point of measurement (feet / meters)
n = discharge exponent (depends upon throat width)
The constant flowrate equation Parshall flume is determined by the selection range of flowrate and the dimension of open channel. More detail is available in the link below
There are two ways to obtain flowrate using ultrasonic. In reality ultrasonic only measures the height. The flowrate equation could be configured either in the ultrasonic transmitter or PLC.
Ultrasonic level to produce flowmeter value
IV.1.1 Selection of 4 wire or 2 wire transmitter
The selection 4 wire or 2 wire transmitter is the intention of the user and evaluation actual condition. These transmitters are called “4-wire” or self-powered. The current signal from the transmitter connects to the process variable input terminals of the controller to complete the loop.
Mostly the reason to use 4 wire as follows:
PLC is not available as acquisition data. The transmitter should have displayed on the transmitter so measurement is readable
Three and four-wire devices incorporate an external power supply in order to effectively eliminate the voltage drop placed on the processed signal current loop
Some device is not available as 2-wire. Some sensor requires external power to drive the chemical/mechanical event in the transducer.
V. INSTALLATION
The initial design was proposed using Parshall flume, the idea was to avoid high force when the maximum flow rate through the primary device. However, the member team decided to use weir for the simplicity of the design. It was understandably the main concern of the project team, Parshall flume is not easy to construct. In addition, there were no local vendors able to precast the Parshall flume.
We decide to use Weir to measure the water meter outflow unit. As a reference, I use Flow Measurement Practical Guides for Measurement and Control Handbook published by ISA.
Weir are the simplest, least expensive, and probably most common type of the primary measuring device used to measure flow in open channels.
After sizing the weir, I don’t pay attention to the installation procedure. There are two rectangular channels. The water flow never stops flowing. The only possible scheme is to place it down during the low water flow. Since it is using concrete, I thought with this weight it will easily dip into the water. Moreover, construction and installation are responsible to the contractor. If the contractor confirms they could install it then it became their responsibility. As a team, we really don’t concern about this until the installation start.
The installation method for the primary device for open water is really critical. It is even more important than sizing. If the installation seems impossible then quickly turn to use other methods.
High water flow is a detriment to the weir or Parshall flume structure.
Since we don’t have a data flowrate outlet, the sensing range flowrate only through observation. I was not sure the water flows were in low or normal flowrate, but it is convincing that it would not disrupt the process when laying down the weir structure using a crane.
It is not as expected, when the weir structure dipped into the water as it water tip the bottom weir structure, the hoist cable start swing. The degree hoist cable swing becomes bigger when the weir dipped deeper to water until the crane start to lift from the ground. The installations stops and not continue.
Basically there are two option solution from my knowledge
To find a way for a better method of installation. However, there still a risk if the installation fails again. Moreover, the remaining project budget reveals that there is no room for failing.
Change the flowrate measurement method with an admissible installation scheme.
After gathering information, the most reasonable is option 2. It automatically changes the equation to
Q = A x v
A = surface area
V = velocities
A = length x width where length is similar to height (H). Height(H) will be determined using the ultrasonic sensor. The width of channel is 2 mtr.
Now to determine the method velocity.
The first option is using the non-contact method
Non-Contact Sensor
The velocity could be measured using ultrasonic or laser. Laser velocimeter has a laser diode to determine the stream’s level by emitting an ultrasonic pulse and measuring the time it takes for the an echo to return for the stream’s surface. The transducer is both a pulse transmitter and an echo receiver. Certain manufacturers already provide integrated between velocity sensor and level sensor. Since the ultrasonic is measuring the level. The remaining sensor is the velocity
It could be installed on the surface. Since the flow much turbulence it is and a lot of ripple on the surface. We consult to the vendor, their recommendation is to
Contact Sensor
The Second method contact by immersing the sensor
The other could be installed inside the water. The sensor is installed at the bottom of the channel.
Not many vendors provide this sensor. I search on the internet, that moment I only find Mainstream Measurement. It sells variety product of sensor in immersed water.
The velocity sensor is designed to operate immersed in the liquid and is installed at the bottom of the channel where the measurements are to be taken. Below are photos during the installation of velocity sensor immersed in water.
We finally complete the project. Thank you for all the team who participate in this project especially my colleague construction engineer (Mr.Chris) who design the structure to hold the immersed velocity sensor. It was critical to complete this project.
For companies that business lies in upstream industries where continuously to explore new reservoirs to deliver the amount of gas according to a contract agreement. Exploring new potential reservoir, installing wellhead and tie-in the flow line to existing manifold called well connection. Well-connection is the heart that pumps the company (upstream industries) to operate and run. The various engineering work of well-connection is repetition and could be grouped based on typicality. Since well-connection is repetitive work and a tight schedule, often it is overlooked. Improvement is always open if we have comprehensive knowledge of technology.
Improvement along with cost reduction will have outcome optimization. For a mature exploration field, the term “optimization” plays a major role in cost savings. Optimization is targeted to reduce significant costs either Capex (Capital Expenditure) or Opex (Operating Expenses).
Cost reduction is responsible for all entities in the organization.
As a Senior Instrument and Control Design Engineer, you often encourage yourself to bring a new idea for improvement and delve into the details. On several occasions, improvement is proposed and requested by the production and process department. Other disciplines such as electrical, instrument and control systems will support this request. This particular improvement, it is initiated by self-insight. The objective was to gain self-accomplishment to give added value to the company.
II. OBJECTIVES
For this case improvement and cost optimization is addressed on wellhead and wellhead flow line measurement which is part of well-connection work.
III. EXISTING DESIGN
III.1. WELLHEAD
Below are the typical schematic connection to measure pressure and temperature on the wellhead x-mass tree. The Wellhead platform is located remote where no electrical power is available. The measurement uses a paper chart recorder. The paper chart recorder movement is either powered by internal batteries or mechanical key wounding. Paper chart recorders (well-known brand Barton) are measuring and recording wellhead parameters as follows:
Annulus Pressure (Casing Pressure)
Tubing Pressure (Production Pressure)
Tubing Temperature (Production Pressure)
III.2 FLOWLINES
Whilst the typical measurement flow rate (compensated) on flow line as seen below. Measure parameters are as following:
Differential Pressure (inH2O)
Pressure upstream Flow Element(static, barg)
Temperature flowline (degC)
Within this configuration, NUFLO Scanner 2000 is using internal battery 7.2V 17Ah. The internal battery is not rechargeable. The internal battery should be continuously expedited. The other problem is a decision when to purchase the internal batteries in order not too long place in storage. Guidelines for storing batteries should be followed to avoid excessive self-discharge.
IV. THE IMPROVEMENT and OPTIMIZATION
Based on the two device measurement on wellhead and flow line, it could be integrated only using NUFLO Scanner 2000 as schematic connection below
This improvement is to optimize the capability of NUFLO Scanner 2000. NUFLO Scanner 2000 able to receive additional 2 analogue input if it utilizes additional cards (expand I/O).
2 Analogue input will be assigned for:
1 ea analogue input to be assigned for Pressure Tubing (production)
1 ea analogue input to be assigned for Pressure Annulus (casing)
The remaining tubing temperature will utilize the RTD sensor currently being used for the temperature flow line. Meanwhile, RTD on the temperature flow line will be replaced with a temperature gauge. You will instantly notice, the temperature is different between the wellhead and the flowline. The temperature on the flowline is lower than the temperature on the wellhead. If we use input temperature from the wellhead it will affect the flow rate calculation. But this difference is not significant and it is acceptable.
Since this application is not for metering purposes but rather to control manual choke valve opening. In addition, throughout the well life cycle, fluid density is held constant, thus temperature will not main factor for flow rate compensation.
The other option is to use temperature on wellhead only for recording, not as input for flow rate compensated equation. The temperature for flow rate compensated is considered as constant, set by the metering team.
Both pressure sensor for pressure casing and tubing signal is conveyed with an output of 4-20mA. As stated previously, an existing configuration is using internal power. In order NUFLO Scanner 2000 could be as loop power two wires, it will require an external power supply 24VDC.
The external power supply 24VDC is provided by the lithium-ion battery power pack. It is rechargeable meanwhile internal battery is not rechargeable.
The lithium-ion battery power pack should be equipped with a protection feature such as a protection circuit that limits the peak voltage of each cell during charge and prevents the cell voltage from dropping too low on discharge. In addition, the cell temperature is monitored to prevent temperature extremes. The maximum charge and discharge current on most packs are is limited to between 1C and 2C. With these precautions in place, the possibility of metallic lithium plating occurring due to overcharge is virtually eliminated.
V. ADVANTAGE & DISADVANTAGE
Despite improvements with its advantages, any modification has its drawback to be considered. Often disadvantage comes from other aspects which not related to improvement.
The following are advantage of this improvement
Paperless
Higher accuracy reading due to digitizing reading
All data parameters are recorded for up to 30 days
Meanwhile the disadvantage as following
High initial cost for battery power pack (including charger)
Additional work for carrying battery power pack for recharge
To define who will be responsible to maintain the lithium-ion battery pack, electrical team or the instrumentation team.
Not yet found a product that conforms to hazardous area certification for this battery type. Hence, it should be located outside zone 2 (non-classified area
VI. POWER CONSUMPTION
The remote wellhead platform does not have an electrical source. External power will be provided by power pack batteries. Batteries power packs are very custom, in order to able to select the battery power pack. Power consumption should be calculated.
Based on the average lifetime of an internal battery, the average current consumption NUFLO Scanner 2000.
Note :The average lifetime of the internal battery could result different if you control the update rate. So this calculation result might be different depends on the update rate requirement.
1 ea lithium-ion battery pack with 24VDC and 46.99 Ah may have different weights among the manufacturer. Battery lithium-ion with a capacity of 40 – 50Ah 24VDC would weigh around 11 – 13 kg. It is considered heavy. In this design, I decided to select batteries with weights 5 up to 7 kg. However, within this selection weight, the capacity will be rated 20 – 25 Ah. The selection of battery weight is related to the charging method. The expected duration of the lifetime will reduce up to 45 days.
VII. CHARGING METHOD
A lithium-ion battery is critical during charging. This is why I decide no automatic charging onsite. Moreover, power by solar panels is not considered since this material is highly attractive for thievery. If the batteries have reached minimum level voltage, then the batteries will be carried out to onshore (accommodation) for recharging. Since the charging is onshore, attention should be address to consider the weight of batteries to be hand carry.
1 ea lithium-ion battery pack will cover 1 NUFLO Scanner 2000 with associated sensors. Yes, you could increase capacity Ah by configuring parallel but since this installation is in a hazardous area it would be safer not to configure batteries in parallel or series. Parallel/series battery configuration has the possibility to generate a spark when fixing or dismantling the connection bar. So I recommend only using an individual battery pack. As possible the location battery should be categorized as a non-classified area (outside zone 2).
Onsite, batteries will continue to discharge. Therefore, the lithium-ion battery pack should be facilitated with a battery management system in order to maintain the voltage does not go below the minimum voltage. When the battery has reached the minimum it should able to give an indication to the operator and it will automatically cut power to the device (load) in this case NUFLO Scanner 2000 and accessories sensors.
VIII. BILL OF MATERIAL
Next are selection material to perform the modification
IX.CAPITAL COST
I could not provide comprehensive capital cost. This capital cost intended for comparison. I didn’t consider the cost of man-hour to perform this modification.
The gain of improvement is estimated USD 1788.45 (USD 5500 – USD 3711.55). Usually, this value is small compared to overall well-connection work. However, if in 1 year at least there are 50 well connections, this saving is worthy.
This price quote was in 2018
Conventional Barton Chart approximately $ 5500 USD
X. IMPLEMENTATION
I have not yet implemented this improvement and optimization due to the procurement company policies of batteries. Company has restricted import product directly without any local agent. We are trying to solve this issue. Hopefully in the future, I could update the result.
I would like is to share experience and knowledge through this article. This was based on my experience. In this article, I wouldn’t explain the basic concept of wireless. There are a lot of good sources if you want to learn wireless transmitters.
The authors will not be responsible for any loss or damage arising out of or resulting from a defect, error or omission in this document or from any users use or reliance on this document.
This article does not attempt to detail minor differences between WirelessHART and ISA100Wireless devices; nor features specific to the vendor; nor provides exhaustive studies of integration with various host systems.
Anyway, the manufacturer’s instructions on the use of any commercial product must be followed at all times, even if in conflict with the information in this publication.
The objective is to offer another system which has similar to wirelessHART/ISA100wireless. It can be considered as another option for a wireless system. It is a combination between wire and wireless but eliminating the high-price part .e.g multipair cable, variation cable tray size.
The reason I say it similar is based on several factors :
Same standard technology in antenna.
It is possible to use Mesh topology although different standards as wirelessHART / ISA100Wireless.
It doesn’t require a Programmable Logic Controller (PLC) to manage and retrieve the data. It could directly retrieve by Human Machine Interface(HMI).
Wireless networks offer highly flexibility installation for existing building and offshore platform structures. Henceforth, wireless significantly reduces installation costs. In certain occasion, installation of sensor/transmitter will encounter difficult to hook-up which require a lot of scaffolding, no possibility to lay cable tray and cable due to road crossing or separate location by road/sea, etc.
During my early career as Instrument and Control System Design engineer, I always design with the most sophisticated and latest product. Thus, sometimes I overlooked at potential problem on maintenance and spare part.
Now, as I have more experience and more involve with different departments, I’m able to look broader views and long term problems.
In example, one of the long-term problems of wireless is providing spare batteries for wireless transmitters. In country which import batteries from the origin manufacture country, mostly there are 2 main problems
Price, some country will not allow to purchase directly from the manufacturer. It has to purchase from the official distributor on that country. The problem emerges if there is only one sole agent. Price often determines by the sole agent not the market.
Delivery time, usually it takes at least 10-12 weeks.
In addition to resolve the delivery time, battery is purchase in advance, but issue of self-discharge and aging should be considered.
Let’s start with the limitation scope of design
Area coverage hundreds meter, WLAN (wireless local area network)
Quantity IO around 10-15 Analogue Input
Remote location meaning there are no or minimum habitat
Only monitoring without supervisory control thus update rate is not essential.
The system architecture is as following
Figure 1. (Without PLC)
The equipment list as following:
Conventional Transmitter, 4-20mA, e.g. Endress Hauser, Yokogawa, Rosemount
IO logik E1200 Series , Moxa
Transmitter, Power Beam antenna, Ubiquiti
Receiver, Omni antenna, Ubiquiti
Industrial Ethernet Switch, unmanageable
Desktop PC with Reliance as HMI application
Actually, we have try with 2 ea power beam antenna and 1 ea omni antenna. Even the PLC as client as well, we don’t find any latency issue.
Another additional feature is to use Programmable Logic Controller (PLC). The system architecture could be as following.
Figure 2. (With PLC)
Basically, PLC is not mandatory if the application is for monitoring only, unless there is something to control.
If PLC will be utilized, there are two option of logical network
Figure 3. Option 1
At the first option, PLC as repository data then HMI (Operator Station) will retrieve all data from PLC.
Figure 4. Option 2
At the second option, there two client simultaneously, PLC and HMI are requesting to Ethernet remote IO.
I use the second option since the remote IO logic E1200 is able to send data in real (floating type). Both HMI and PLC retrieve data in floating type 32-bit. PLC is installed for future development.
All IP is configured based on Private IP Addresses Class C
The first option (figure 1) mostly will be benefit if
The protocol between PLC and HMI and PLC to field device is different, e.g., PLC and HMI is Ethernet I/P while PLC and remote IO Logik is modbus TCP
Redundant HMI
More than 1 client control station
I. IO Logik E1200 Series
The IoLogik E1200 series is Industrial Ethernet remote I/O. It has two embedded Ethernet switch ports that allow information to flow to another local Ethernet device or connect to the next IOLogik in a daisy-chain. More detail could be find in the link
It has 8 AI channel. AI input range has 2 mode. Voltage mode (V) and Current Mode (mA).
Scaling from 4-20mA to engineering unit could be enabled on the device.
If the auto scaling is enabled you don’t need to obtain the raw data. Result of scaling in real type data (Floating point) available from the modbus address. Data format is
II. Antenna, Transmitter and Receiver
The Wi-Fi antenna has capability to support modbus TCP protocol. As this application is using modusTCP, You will need to change the web server mode, server port from 70 to 502 to open the modbus TCP port. The other setting is left to default. Both Transmitter and Receiver have the same configuration.
Radio Transmitter
Radio Receiver
For information, there are server port list could be configured based on well-known and registered port numbers for particular practice as shown table below.
I haven’t yet trial for Ethernet/IP protocol.
III. HMI
Since it using ModbusTCP protocol, arrangement order of double word should be aware when requesting a known floating-point value from the slave. Modbus itself does not define a floating point data type but it is widely accepted that it implements 32-bit floating point data using the IEEE-754 standard. However, the IEEE standard has no clear cut definition of byte order of the data payload. Therefore the most important consideration when dealing with 32-bit data is that data is addressed in the proper order. I’m using reliance product HMI to display the correct value on HMI, it need to swap byte and swap word. You could find more detail on regulation of IEEE modbus floating 32bit data.
IV. Comparison
IV. 1 Cost
The
scale of project is one of the key factors for cost justification of wireless
into a project. Design Engineers should assess and incorporate the following
factors in their project cost estimating calculation model:
Reduced engineering costs
Wi-Fi + Ethernet remote I/O could not fully eliminated engineering cost for :
Tray and cable routing
Detail support cable tray
Cable schedule
Remote IOLink wiring diagram
Meanwhile wireless system could be eliminated pertaining cable drawings and documents. In the other hand, other engineering document should be submitted such as
Identify the necessary update rate of each WirelessHART/ISA100Wireless device to meet the specifications of the application as well as battery life.
Determine the capacity of the gateway determined by the maximum update rate to be used in the network
Use the following calculation to determine the number of gateways.
Reduced labor
Both Wi-Fi+Ethernet remote IO and wireless system is significant to reduce labor cost.
Reduced materials and material cost
It is possible that the main materials of Wi-Fi + Ethernet remote IO could be selected with a much lower cost than a wireless system. Although Wi-Fi + Ethernet remote IO still needs to utilize cable trays and cable but it has reduced significant material such as
Multi-pair instrument cable is not necessary.
More uniform of cable tray size
Cable gland with uniform size
One of advantage using Wi-Fi+Etherent remote IO is the flexibility to select the product. Wide range product of conventional 4-20mA transmitter as well as wide range product of Industrial Ethernet remote I/O / Gateways. If you have tight budget you could consider this option. Henceforth, with carefully design it is able to obtain overall cost lower than Wireless system.
Below are typical of material list for Wi-Fi +Ethernet Remote IO + Transmitters (This is only example for comparison)
Below are typical of material WirelessHART (This is only example for comparison )
Below are typical of material ISA100Wireless (This is only example for comparison )
IV. 2 Antenna
Wi-Fi antenna and Wireless transmitter antenna basically have the same method as following
Frequency band 2.4-2.5 GHz Instrument Scientific Medical (ISM) band
Standard modulation 802.11g
Note: Wi-Fi antenna is covering all transmitters while wireless transmitter antenna is dedicated. Therefore you should assess the location of transmitter in order to obtain the acceptable gain and able to select the antenna.
WirelessHART/WirelessISA100 use omni directional antenna to support Mesh topological.
The selected Power beam and Omni antenna use standard modulation 802.11g
IV. 3 Topology
The main difference is the ISO protocol stack at Level 1 and 2 which address by standards IEEE 802.15.4 for ZigBee, ISA100Wireless, WirelessHART, WIA-PA, and several others. Each of these standards has added its own upper-layer protocols to suit applications in many different markets.
WirelessHART/Wireless ISA use the newest technology and most revolutionary form of network is called a mesh. In a mesh network each station is both an end device and a network forwarding element. Mesh networks are naturally self-healing and redundant—exactly the properties needed for industrial automation networks.
IV. 4 Security
ISA100 Wireless and WirelessHART posses built-in security. This will be differ with Wi-Fi where You need to specify how level safety of the system. At minimum, firewall need to be installed on the Host (operator work station).
However, based on my assessment for this system. In this installation, the location was remote, by means the location is far from the resident. It will be obvious and suspicious when unrecognized person around that area.
The process plant are surrounded by fence with radius define using method of restricted area.
The system is still localized, not connected to any other company network (business network). Hence this system is sufficient.
V. References and Bibliography
Dick Caro, “Wireless Networks for Industrial Automation”, 2014
Emerson Process Management, “IEC 62591 WirelessHART System Engineering Guide, Revision 3.0”,2012
I remember my experience as trainer for chemical injection (CI) system on 2016. The attendees were operator, maintenance, and inspection/corrosion team. The course was focused on technical issue.
The course details related to various elemental aspects of the chemical injection system from design of the system including valves, pumping, monitoring, and delivery . It cover in depth of
The various design aspects of the equipment
involved.
How to operate and monitor the performance of
chemical injection packages.
We create pretest and post test to ensure the participant obtains benefit from the course.
Besides to transfer knowledge, the objective of this
workshop and training is to increase level competence and reduce number of
problems during normal operation.
Mostly on our site, chemical injection system is use to protect flow line pipes from corrosion. The chemical injection will maintain corrosion rate below allowable rate. It is injected on the X-mass tree upstream choke valve.
Chemical injection system will be tailor to meet the specific requirement. The schematic shown are typical schematic use to protect flow lines. So it might be different schematic CI for different application.T
The schematic is taken for SkoFlo catalog
Understanding the equipment involved play important role. If one equipment failure it will affect the entire performance. Even wrong setting on back pressure regulator (BPR) would disrupt the performance.
In our facilities, chemical injection system could be
categorized of two types, as following.
Multi injection system
Single injection
The basic different of this system is how to set the flow rate.
In multi injection system flow rate are set individually on the flow control valve. This flow control valve is a pressure independent flow control valve. Once the valve is set at a desired flow rate, that flow rate is maintained even though the pressure conditions upstream and/or downstream of the valve may change considerably.
For single injection, flow rate is control using adjustment pump stroke length and stroke rate, without necessity to install flow control valve and back-pressure regulator. Pump should size properly in order to achieve target flow rate.
In addition, back pressure regulator and flow control valve is utilized for single injection with over capacity pump (based stock on hand) where injection flow rate is difficult to achieve using adjustment of pump stroke length and stroke rate.
Equipment of chemical injection system based on the schematic consist of
Chemical injection pump
Back pressure Regulator
Pressure Safety Valves (PSV)
Gauge drum
Dampener
Pressure Gauge
Flow control Valve
Note: Back pressure Regulator and Flow Control Valve is using a well-known brand SkoFlo
A.PUMP
Pump is reciprocating positive displacement pumps. The pump could be pneumatic driven or electrical driven. In multi injection system, pump will be operated based on highest well flowing pressure. Meanwhile stroke length and stroke rate is set at the total flow rate require for each well. Pump discharge pressure is recommended to set at: highest well pressure + 200 up to 400 psi + 13.8 barg
Note: +14 barg is really specific for flow control valve manufactured by SkoFlo valve
B. BACK PRESSURE REGULATOR (BPR)
It is specially
design for multi injection; however it could be used for single injection if
the pump is overcapacity.
Since on multi injection system, pump will deliver flow rate at total flow rate from each well, so overflow to the system network injection will occur. Back pressure regulator will dispense the overflow chemical injection back to the tank. I suggest the back pressure regulator is set at 80% of pressure safety valve.
Set point BPR is not regularly to be adjusted. Set point of BPR is also to maintain differential pressure between injection line and wellhead pressure at minimum 13.8 barg.
This is one of
requirement of flow control valve which require minimum differential 14 barg
between upstream and downstream to obtain stable injection flow rate.
C. FLOW CONTROL VALVE
It is design to
regulate injection flow rate for each flow line. Unlike other control valve
where flow will alter as system pressure changes, this specific flow control
valve maintains a constant differential pressure across a fixed calibrated
orifice, thus resulting in a constant flow through that orifice. As
differential pressure is independent of system pressure changes, the flow rate
is stable in all field conditions. However minimum 200 psi (13.8 bar) dP across
the valve is required for the flow rate ranges.
D.PRESSURE SAFETY VALVE (PSV)
Pressure safety valve is not based on API 520. This safety valve has similar function as back pressure regulator, but it has different intention. BPR is intended for normal operation it will open and close regularly.
Meanwhile PSV will open for particular case, e.g.
Blocked outlet by any isolation valve
Clogged CI Injection line lead to over pressure
Therefore, PSV set pressure is at maximum allowable pressure / Wellhead shut in pressure.
During the training session, we heard many problems
regarding chemical injection system from our operation e.g.
Pumps not working,
Plugging on the flow control valve,
Seat inside flow control valve disintegrate
Corrosion rate exceeded, etc.
My recommendations for these kinds of problems were
a. If pumps not working
Many causes could result pump not working. However, before examining the pump. I recommended checking pressure gas regulator + filtering regularly, since the supply is from hydrocarbon gas where water content might high. This would reduce the pump pressure discharge, after prolonged use without regularly drain the filter, this condition could lead the pump stop working.
b. Seat inside flow control valve damage / disintegrate.
This could occur if the flow control valve is located near the pump. Water hammering effect could occur during calibration where closing the valve handle adjustment rapidly. I recommended placing the flow control valve near the injection point. In addition it will optimize function of dampener.
I also find action by personnel which degrade the performance
of multi injection system.
First, changing pump flow rate by lowering backpressure
regulator set point. This action will affect the minimum differential pressure
require by flow control valve if not properly calculated.
Second, bypassing one of the flow control valve due to plugging. This action will affect the entire injection flow rate to each flow line. By bypassing one flow control valve will disrupt the network pressure. The injection fluid will tend to route to the lowest pressure, in this case the line with bypass flow control valve. In consequence, the other injection line will not meet the required injection flow rate.
Third, Increasing orifice flow control valve intentionally. By increasing the orifice (Cv), it will change the original design of the flow control valve. The manufacturer has engineered and carefully selected the spring, chamber upstream and downstream, and the stem flow control valve. Increasing orifice will change the inherent Cv . In the end this action will disrupt the network pressure. Same consequence found on second cause.
Besides the problems, I receive valuable feedback from the trainee about the chemical injection system. Most of the concerns are not written on technical datasheet, catalog, even manual.
We summarize
and make conclusion in order to maintain the performance and lifetime of the
pump, as following
If pump stroke is at the maximum 45 spm, the
pump spring will often break below 1 month.
We decide to limit the stroke rate at maximum 40 spm.
If stroke length shorten below half size of stroke length. It will often break the spring.
So we decide to maintain the stroke length at minimum 0.5
Low speed of stroke/minute is more preferable than high stroke/minute in delivering the same flow rate